

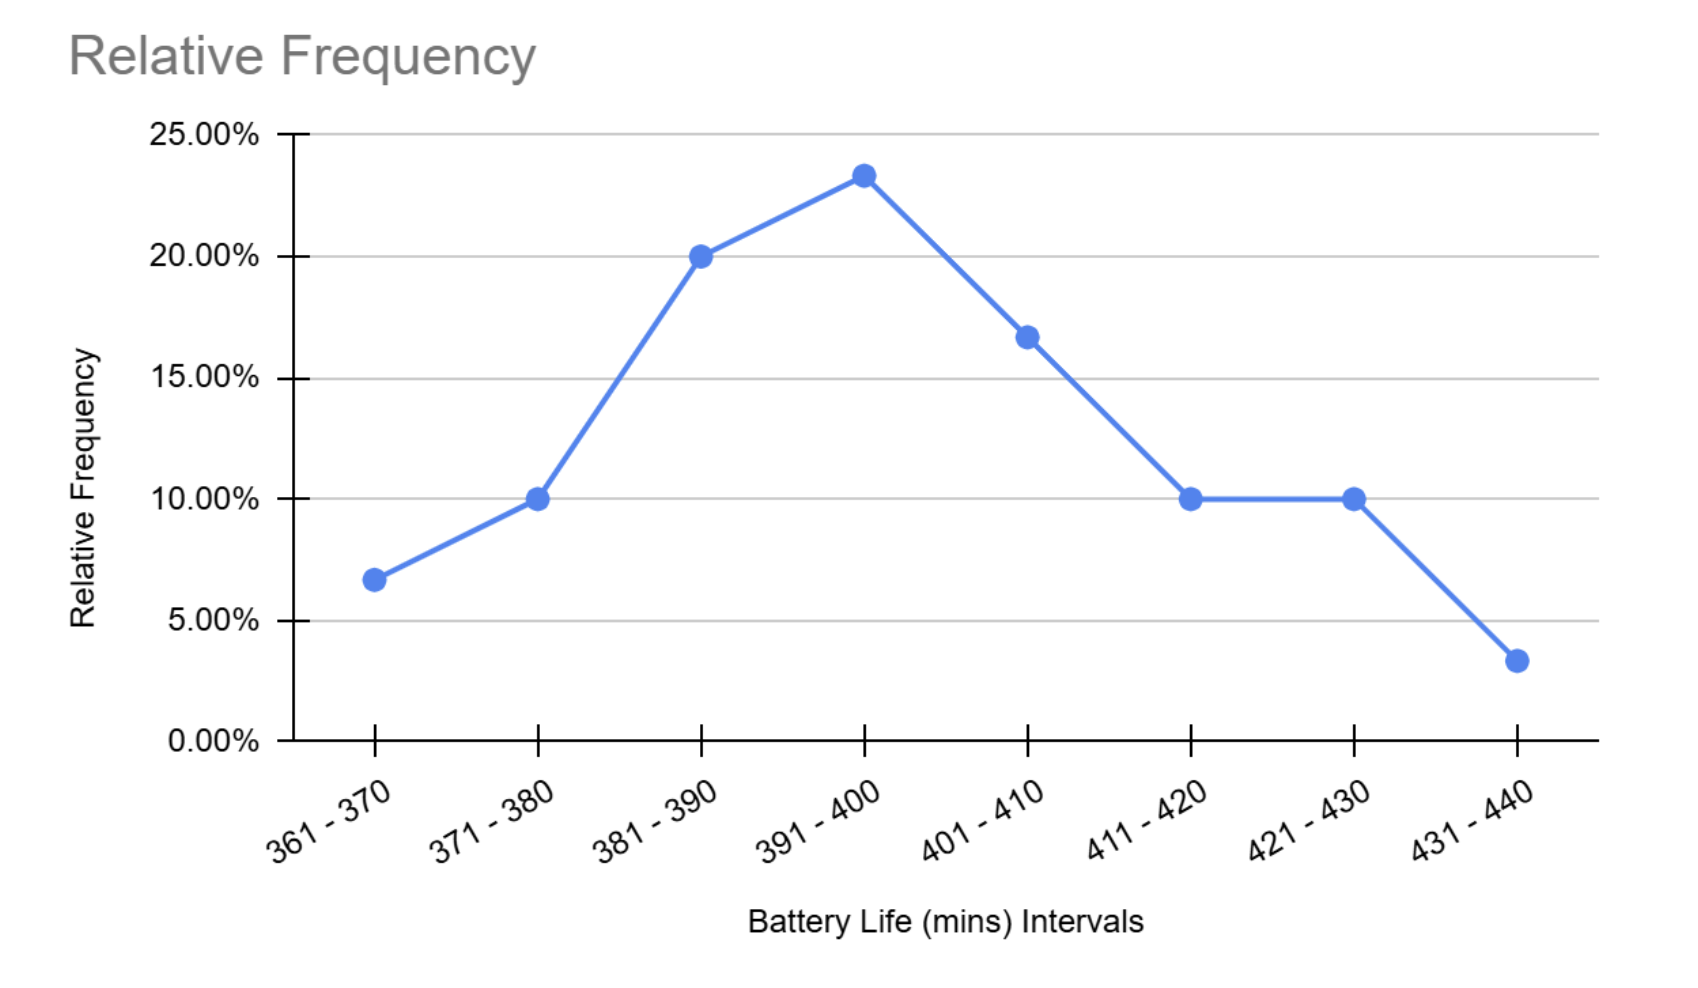
Question: How to draw this graph as a relative frequency graph (including a bar graph and the line graph at the same time). Relative Frequency 25.00%
How to draw this graph as a relative frequency graph (including a bar graph and the line graph at the same time).
Step by Step Solution
There are 3 Steps involved in it
1 Expert Approved Answer
Step: 1 Unlock

Question Has Been Solved by an Expert!
Get step-by-step solutions from verified subject matter experts
Step: 2 Unlock
Step: 3 Unlock