

Question: How to explain the two shape the Box plots & Means and Medians differ when distributions are skewed? SKEWED LEFT SKEWED RIGHT (positively)
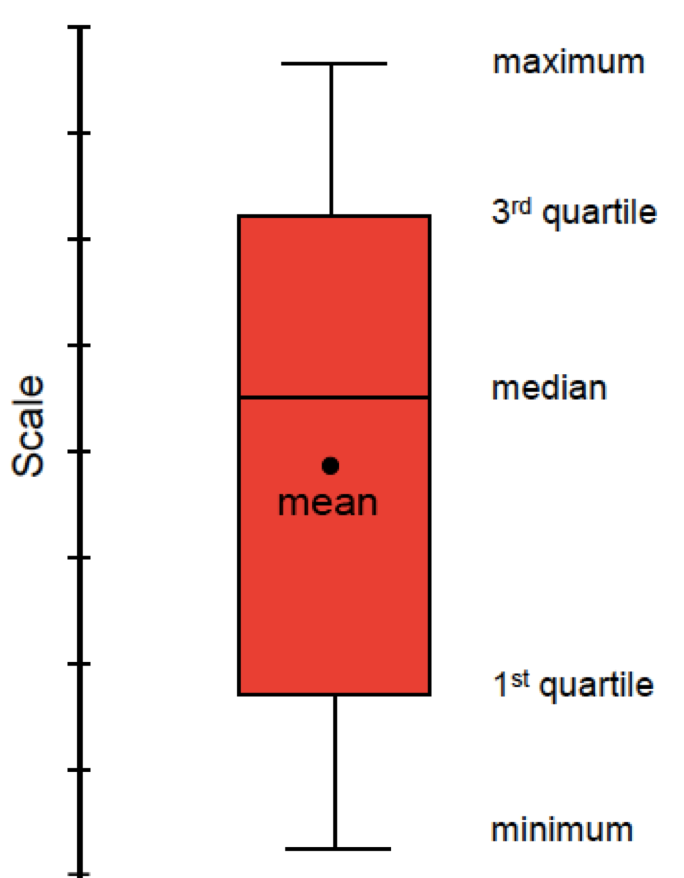
How to explain the two shape the Box plots & Means and Medians differ when distributions are skewed?
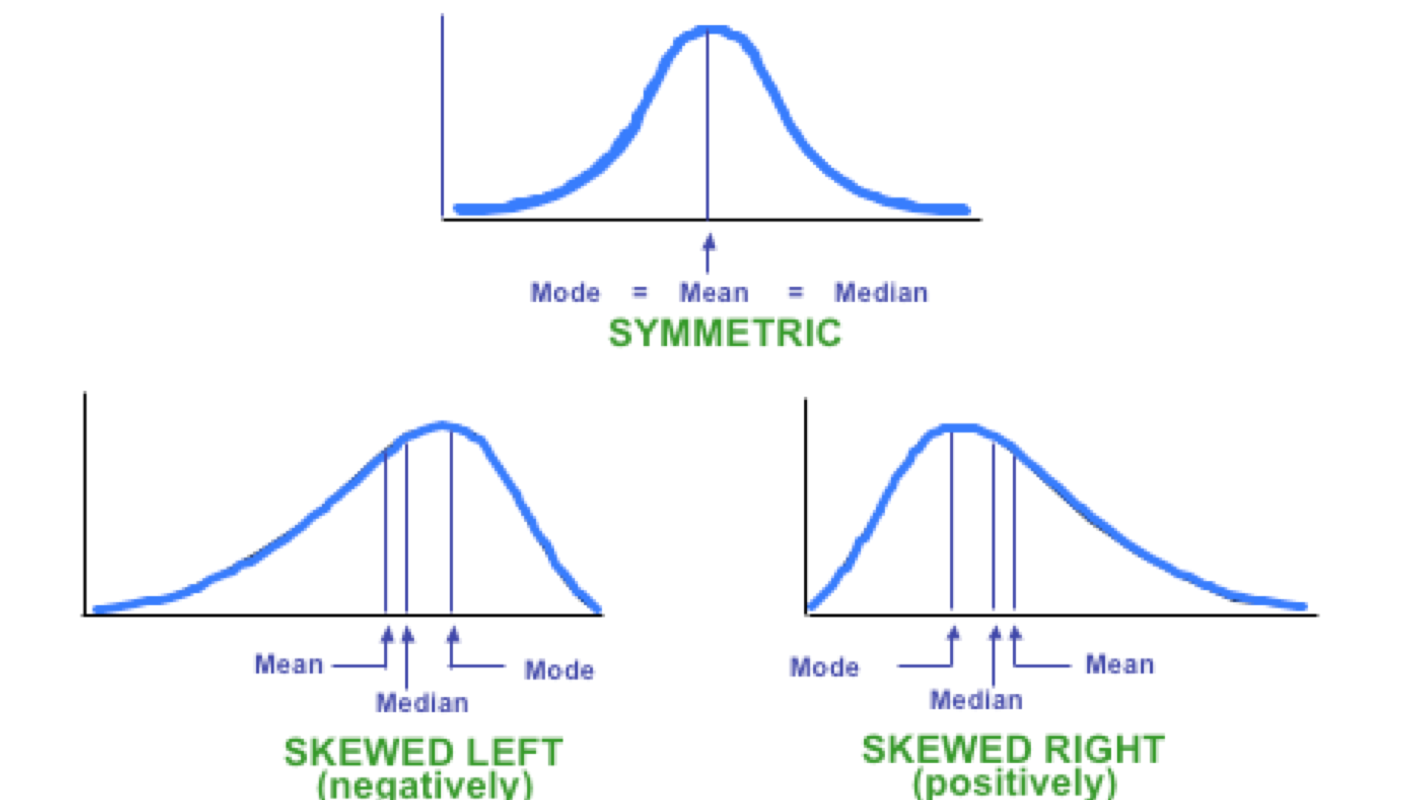
SKEWED LEFT SKEWED RIGHT (positively)
Step by Step Solution
There are 3 Steps involved in it
1 Expert Approved Answer
Step: 1 Unlock

Question Has Been Solved by an Expert!
Get step-by-step solutions from verified subject matter experts
Step: 2 Unlock
Step: 3 Unlock