

Question: How to Explain this numbers & Chart in the picture for a presentation? Please with Explanation fSell 720,000 per month for 1.35 each Break Even
- How to Explain this numbers & Chart in the picture for a presentation? Please with Explanation
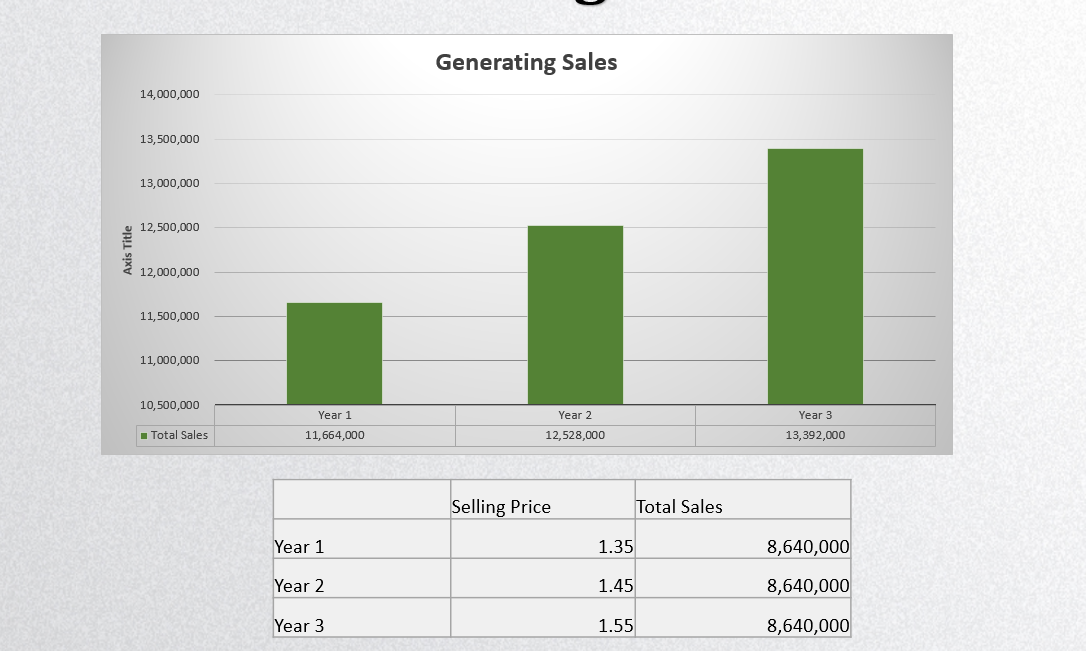

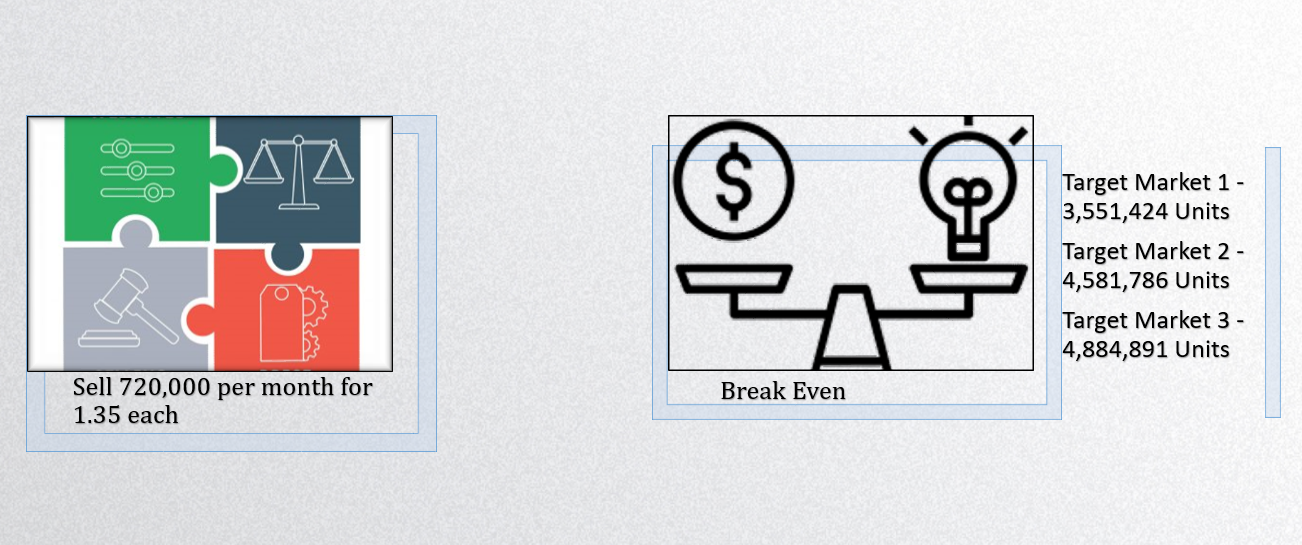
\fSell 720,000 per month for 1.35 each Break Even Target Market 1 - 3,551,424 Units Target Market 2 - 4,581,786 Units Target Market 3 - 4,884,891 Units
Step by Step Solution
There are 3 Steps involved in it
1 Expert Approved Answer
Step: 1 Unlock

Question Has Been Solved by an Expert!
Get step-by-step solutions from verified subject matter experts
Step: 2 Unlock
Step: 3 Unlock