

Question: How to explain this picture in the presentation? Please with explanation: How To explain this picture in the Presentation? Axis Title 14,000,000 13,500,000 13,000,000
How to explain this picture in the presentation? Please with explanation:
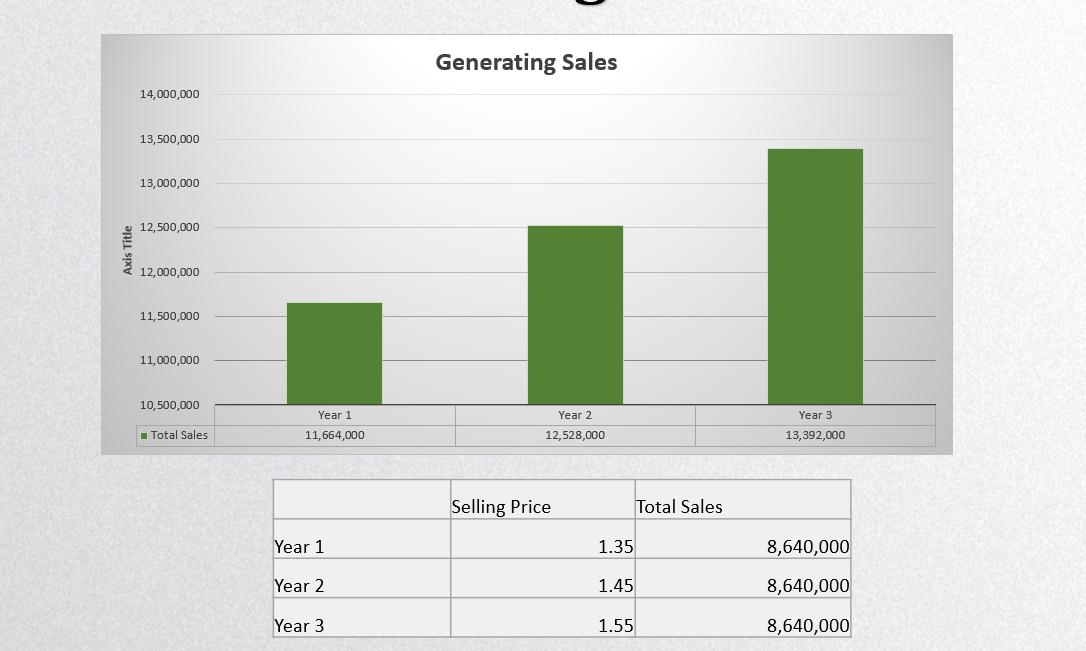
How To explain this picture in the Presentation?
Axis Title 14,000,000 13,500,000 13,000,000 12,500,000 12,000,000 11,500,000 11,000,000 10,500,000 Total Sales Year 1 11,664,000 Year 1 Year 2 Year 3 Generating Sales Year 2 12,528,000 Selling Price 1.35 1.45 1.55 Total Sales Year 3 13,392,000 8,640,000 8,640,000 8,640,000
Step by Step Solution
★★★★★
3.41 Rating (154 Votes )
There are 3 Steps involved in it
1 Expert Approved Answer
Step: 1 Unlock

Question Has Been Solved by an Expert!
Get step-by-step solutions from verified subject matter experts
Step: 2 Unlock
Step: 3 Unlock