

Question: How to formulate AND plot solution on excel? Keystone Products 1. Company works 5 days a week 8 hours each work day 2. Market demand:
How to formulate AND plot solution on excel?
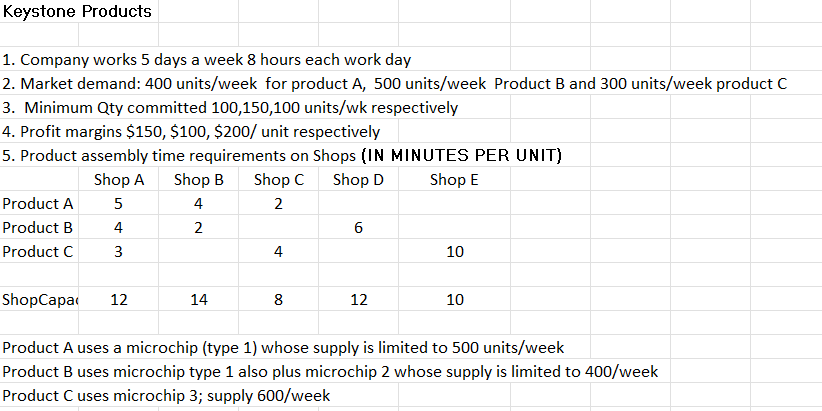
Keystone Products 1. Company works 5 days a week 8 hours each work day 2. Market demand: 400 units/week for product A, 500 units/week Product B and 300 units/week product C 3. Minimum Qty committed 100,150,100 units/wk respectively 4. Profit margins $150,$100,$200/ unit respectively 5. Product assembly time requirements on Shops (IN MINUTES PER UNIT) \begin{tabular}{|l|c|c|c|c|c|} \hline & Shop A & Shop B & Shop C & Shop D & Shop E \\ \hline Product A & 5 & 4 & 2 & & \\ \hline Product B & 4 & 2 & & 6 & \\ \hline Product C & 3 & & 4 & & 10 \\ \hline ShopCapar & 12 & 14 & 8 & 12 & 10 \\ \hline \end{tabular} Product A uses a microchip (type 1) whose supply is limited to 500 units/week Product B uses microchip type 1 also plus microchip 2 whose supply is limited to 400/ week Product C uses microchip 3; supply 600/week
Step by Step Solution
There are 3 Steps involved in it

Get step-by-step solutions from verified subject matter experts