

Question: How to make the excel for this? Please input photos of excel. A B C D F G H 1 The data are for each
How to make the excel for this? Please input photos of excel.
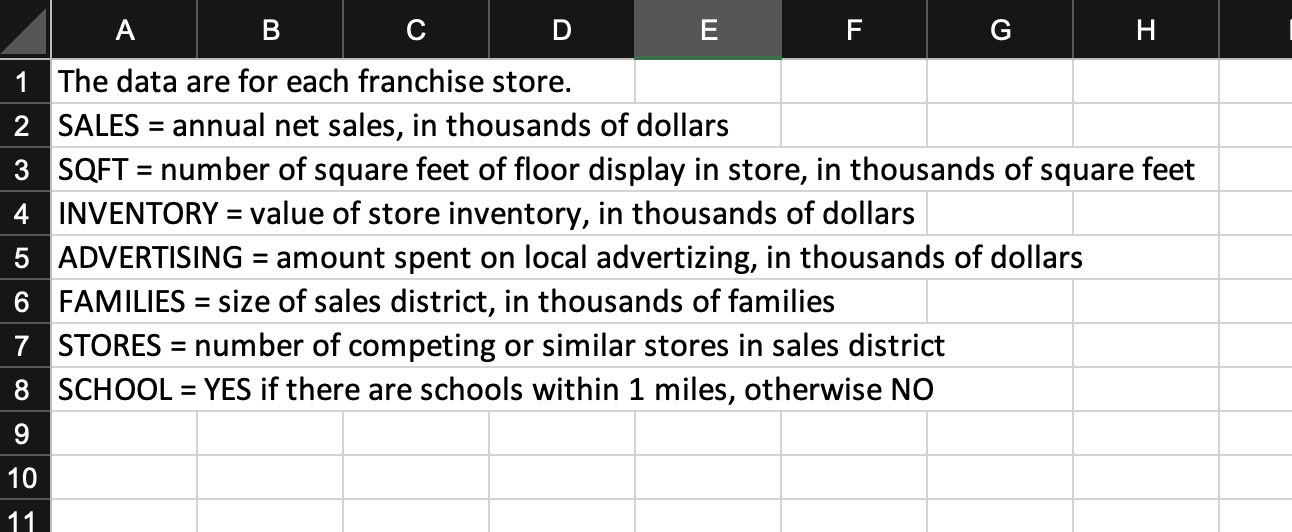
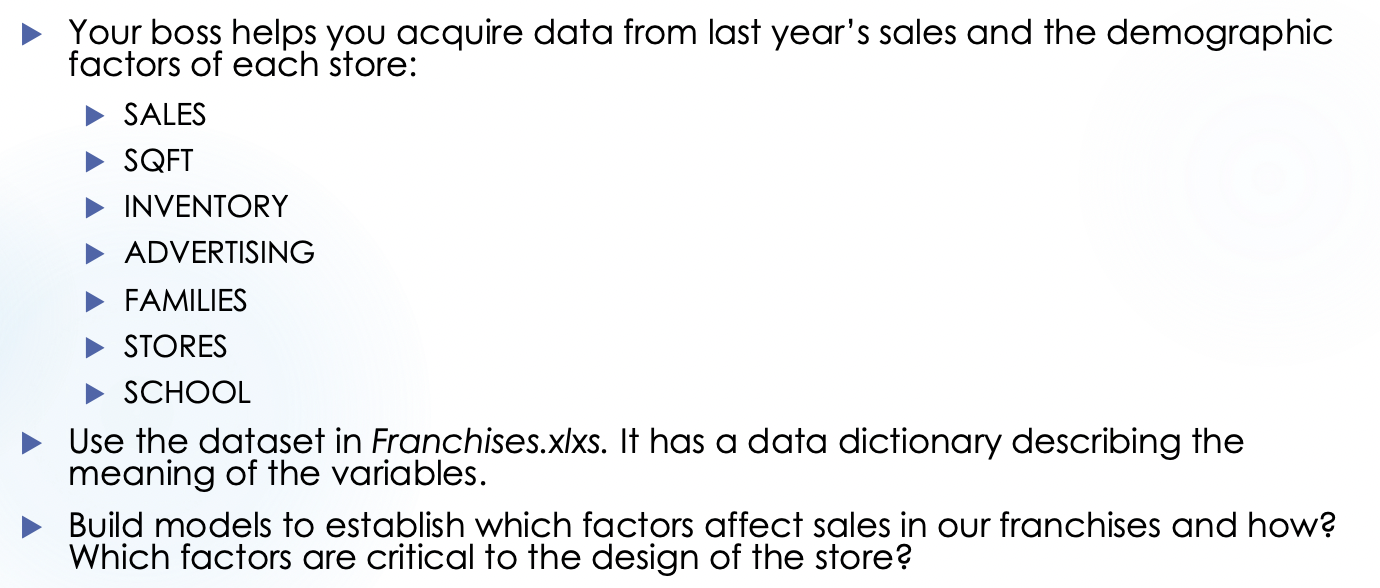
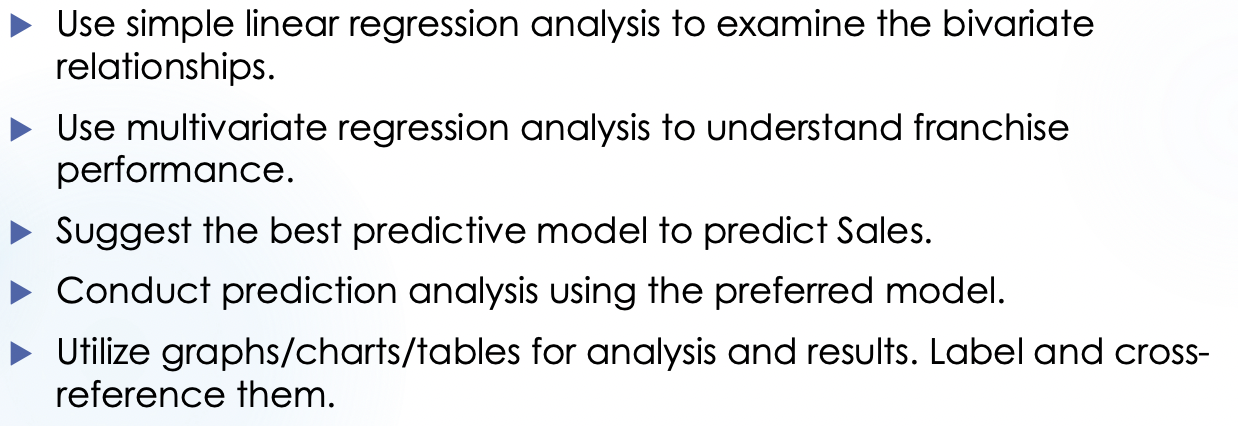
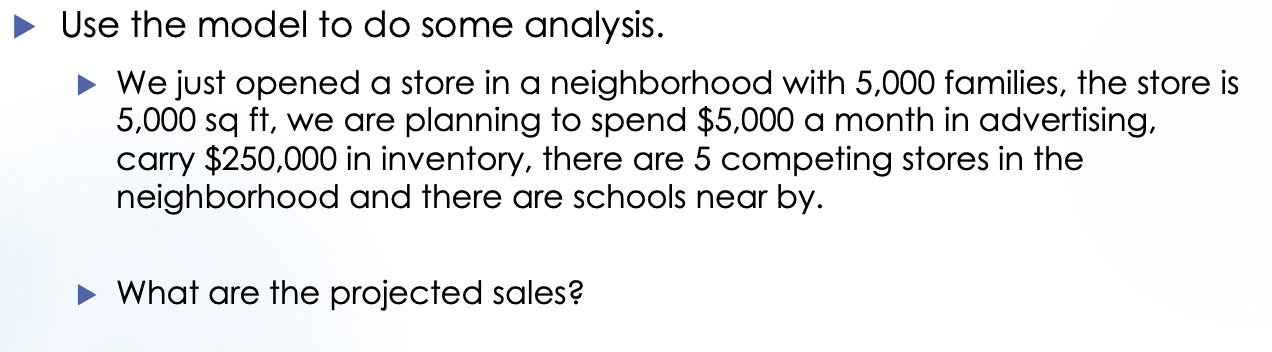
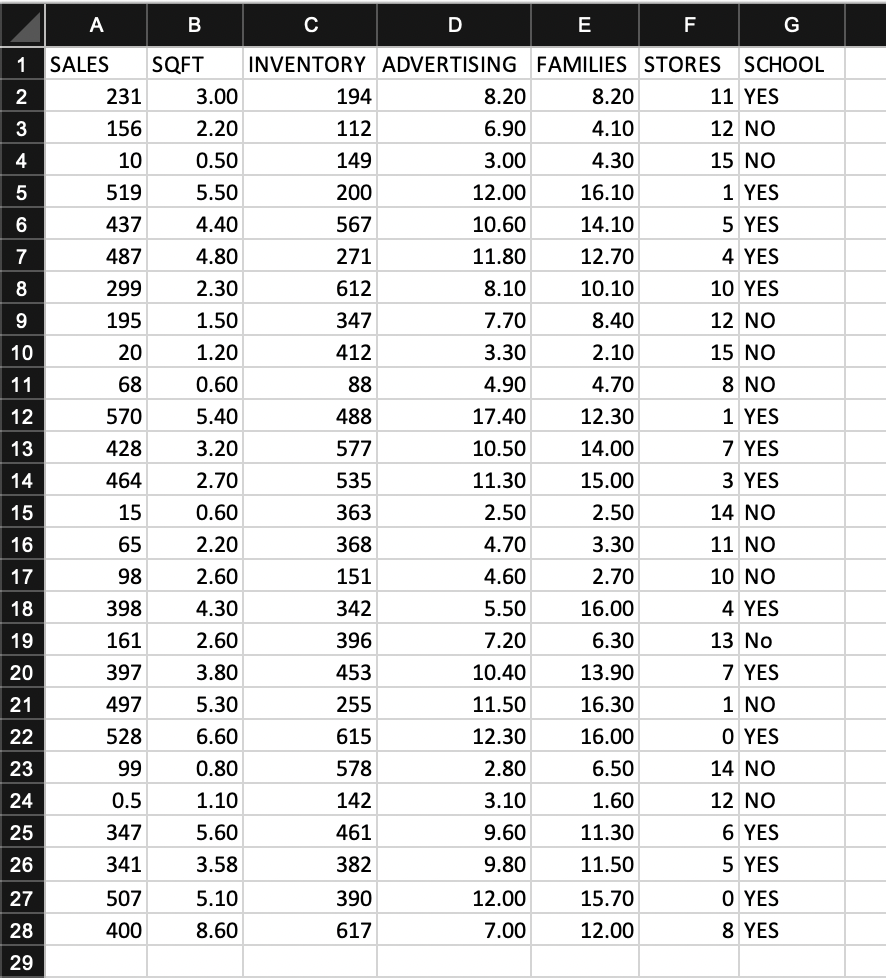
A B C D F G H 1 The data are for each franchise store. 2 SALES = annual net sales, in thousands of dollars 3 SQFT = number of square feet of floor display in store, in thousands of square feet 4 INVENTORY = value of store inventory, in thousands of dollars 5 ADVERTISING = amount spent on local advertizing, in thousands of dollars 6 FAMILIES = size of sales district, in thousands of families 7 STORES = number of competing or similar stores in sales district 8SCHOOL= YES if there are schools within 1 miles, otherwise NO Your boss helps you acquire data from last year's sales and the demographic factors of each store: SALES > SQFT > INVENTORY > ADVERTISING > FAMILIES > STORES SCHOOL Use the dataset in Franchises.xlxs. It has a data dictionary describing the meaning of the variables. Build models to establish which factors affect sales in our franchises and how? Which factors are critical to the design of the store? Use simple linear regression analysis to examine the bivariate relationships. Use multivariate regression analysis to understand franchise performance. Suggest the best predictive model to predict Sales. Conduct prediction analysis using the preferred model. Utilize graphs/charts/tables for analysis and results. Label and crossreference them. Use the model to do some analysis. - We just opened a store in a neighborhood with 5,000 families, the store is 5,000sqft, we are planning to spend $5,000 a month in advertising, carry $250,000 in inventory, there are 5 competing stores in the neighborhood and there are schools near by. What are the projected sales
Step by Step Solution
There are 3 Steps involved in it
To conduct the requested analysis using Excel follow these steps Step 1 Set Up the Excel Workbook 1 ... View full answer

Get step-by-step solutions from verified subject matter experts