

Question: How to plot multiple line chart with multiple lines at thesame time, in python like the image attached the axis parameters can be set to
How to plot multiple line chart with multiple lines at thesame time, in python
like the image attached
the axis parameters can be set to any value..
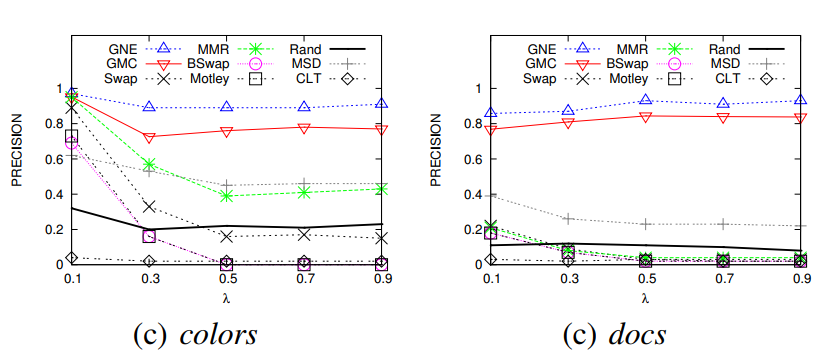
PRECISION 0.8 0.6 0.4 0.2 0 0.1 GNEA... MMR GMC BSwap Swap.X Motley 0.3 0.5 00* (c) colors Rand MSD CLT 0.7 + 0.9 PRECISION 1 0.8 0.6 0.4 0.2 0 0.1 GNEA... MMR GMC BSwap Swap.X Motley 0.3 8- 0.5 (c) docs Rand MSD CLT --> Katsesessara ASASASASKARSK +| 0.7 0.9
Step by Step Solution
★★★★★
3.45 Rating (158 Votes )
There are 3 Steps involved in it
1 Expert Approved Answer
Step: 1 Unlock

USE pltplot TO PLOT MULTIPLE LINES ON THE SAME GRAPH C... View full answer
Question Has Been Solved by an Expert!
Get step-by-step solutions from verified subject matter experts
Step: 2 Unlock
Step: 3 Unlock