

Question: How to plot this in gnuplot? Problem 2. Write C programs for the following When a heat source is placed atx-0 at 0 in an
How to plot this in gnuplot?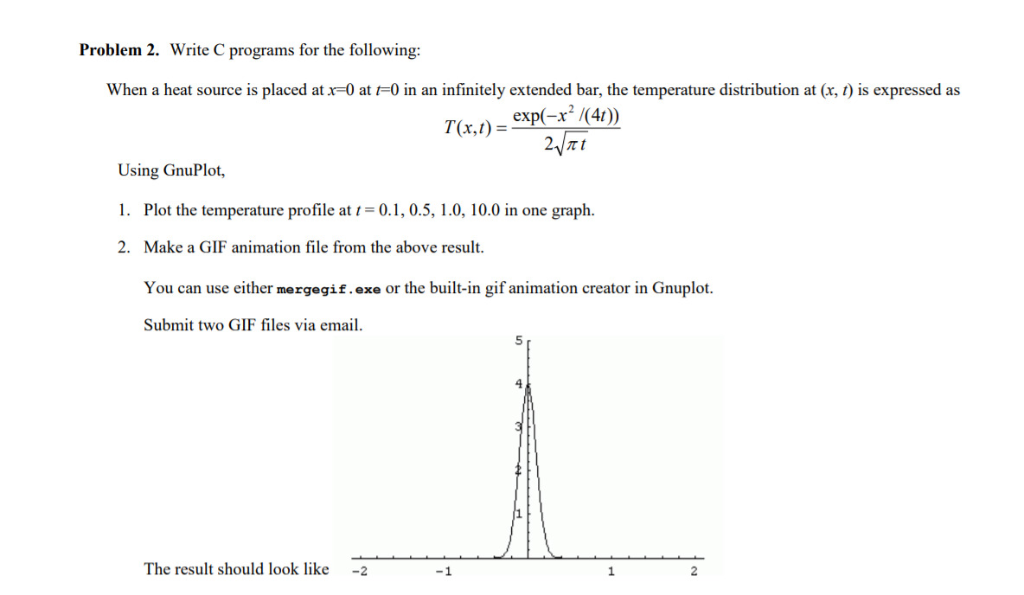
Problem 2. Write C programs for the following When a heat source is placed atx-0 at 0 in an infinitely extended bar, the temperature distribution at (x, t) is expressed as exp/(4 Using GnuPlot, 1. Plot the temperature profile at -0.1, 0.5, 1.0, 10.0 in one graph. 2. Make a GIF animation file from the above result. You can use either mergegif.exe or the built-in gif animation creator in Gnuplot. Submit two GIF files via email. 4 The result should look like2 -1 Problem 2. Write C programs for the following When a heat source is placed atx-0 at 0 in an infinitely extended bar, the temperature distribution at (x, t) is expressed as exp/(4 Using GnuPlot, 1. Plot the temperature profile at -0.1, 0.5, 1.0, 10.0 in one graph. 2. Make a GIF animation file from the above result. You can use either mergegif.exe or the built-in gif animation creator in Gnuplot. Submit two GIF files via email. 4 The result should look like2 -1
Step by Step Solution
There are 3 Steps involved in it

Get step-by-step solutions from verified subject matter experts