

Question: How to solve it step by step Question 1 Partially correct Marked out of 12.00 P Flag question Take me to the text Perform a
How to solve it step by step 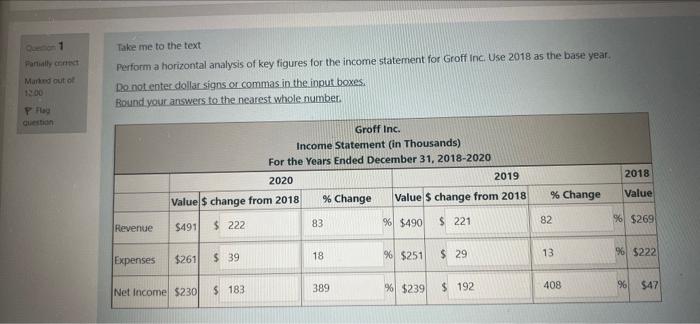
Question 1 Partially correct Marked out of 12.00 P Flag question Take me to the text Perform a horizontal analysis of key figures for the income statement for Groff Inc. Use 2018 as the base year. Do not enter dollar signs or commas in the input boxes. Round your answers to the nearest whole number. Groff Inc. Income Statement (in Thousands) For the Years Ended December 31, 2018-2020 2020 2018 Value Value $ change from 2018 % Change % $269 Revenue $ 222 $491 Expenses $261 $39 % $222 Net Income $230 $183 % $47 83 18 389 2019 Value $ change from 2018 % $490 $ 221 % $251 $29 %$239 $192 % Change 82 13 408
Step by Step Solution
There are 3 Steps involved in it
1 Expert Approved Answer
Step: 1 Unlock

Question Has Been Solved by an Expert!
Get step-by-step solutions from verified subject matter experts
Step: 2 Unlock
Step: 3 Unlock