

Question: how to solve Keeping use the data set for this question and the next 2 questions: The following scores represent a nurse's assessment (x) and
how to solve
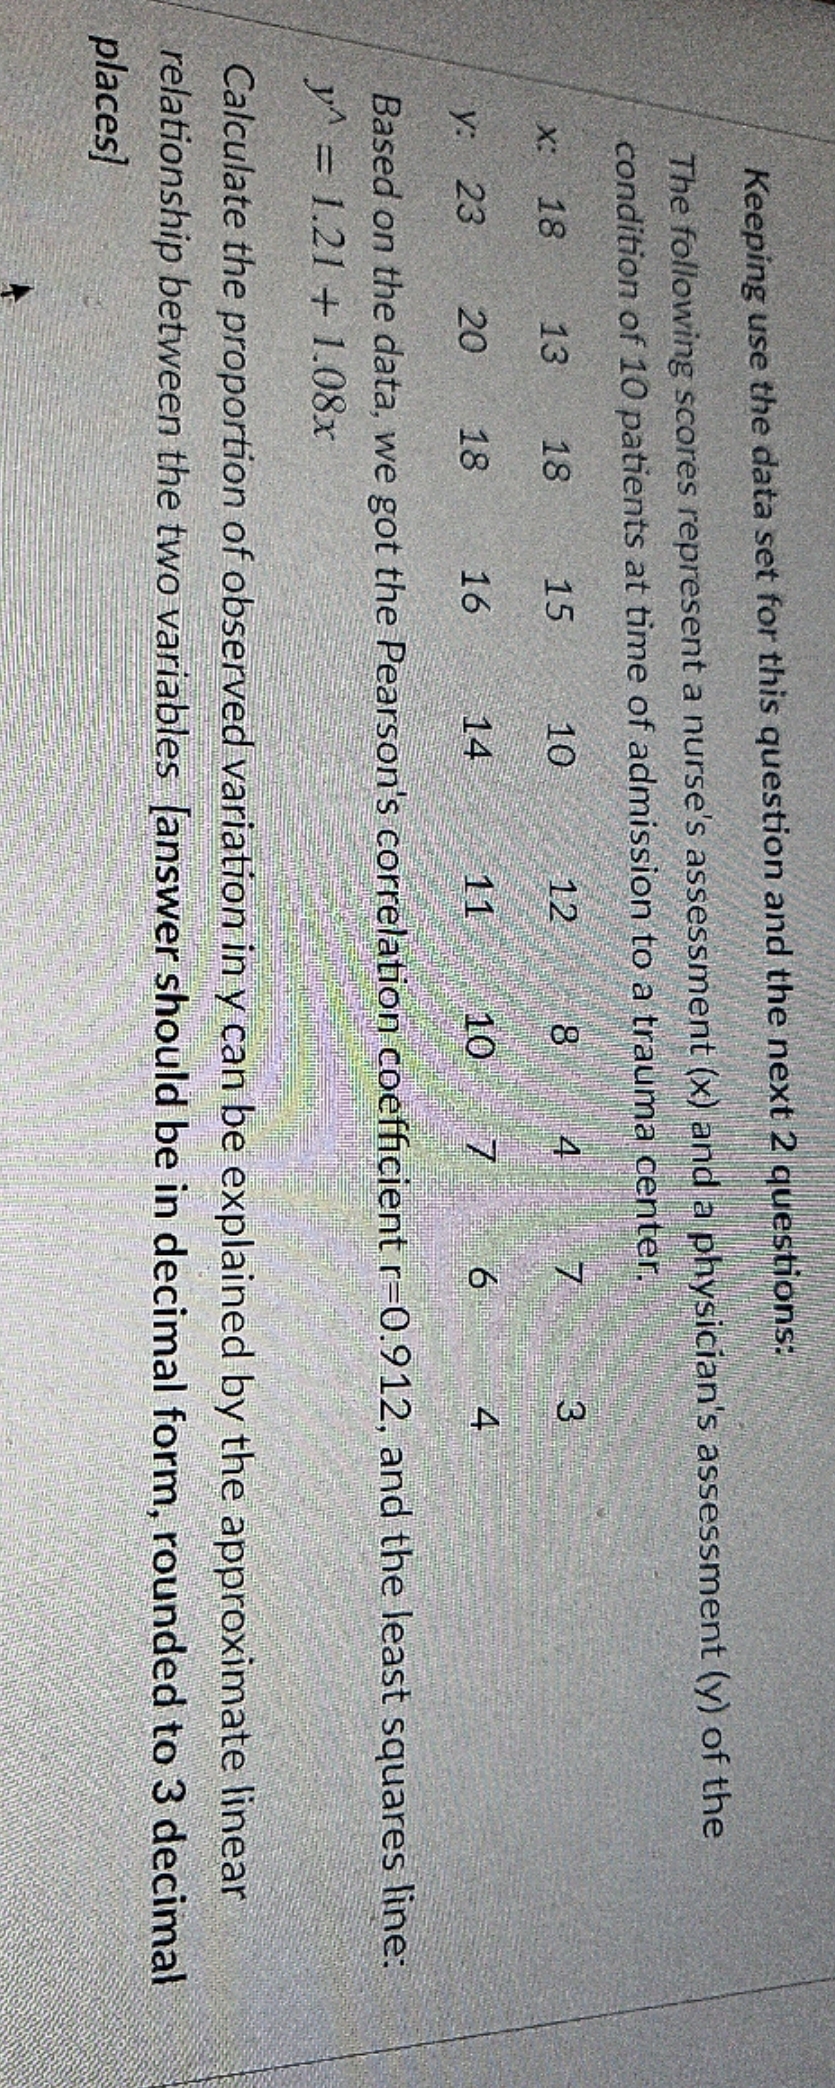
Keeping use the data set for this question and the next 2 questions: The following scores represent a nurse's assessment (x) and a physician's assessment (y) of the condition of 10 patients at time of admission to a trauma center. x: 1 co NO Based on the data, we got the Pearson's correlation coefficient r=0.912, and the least squares line: y^ = 1.21 + 1.08x Calculate the proportion of observed variation in y can be explained by the approximate linear relationship between the two variables Janswer should be in decimal form, rounded to 3 decimal places
Step by Step Solution
There are 3 Steps involved in it
1 Expert Approved Answer
Step: 1 Unlock

Question Has Been Solved by an Expert!
Get step-by-step solutions from verified subject matter experts
Step: 2 Unlock
Step: 3 Unlock