

Question: How to solve Please explain fully how you got the answers in terms of solving and use graphs in each question to show understanding Q
How to solve Please explain fully how you got the answers in terms of solving and use graphs in each question to show understanding
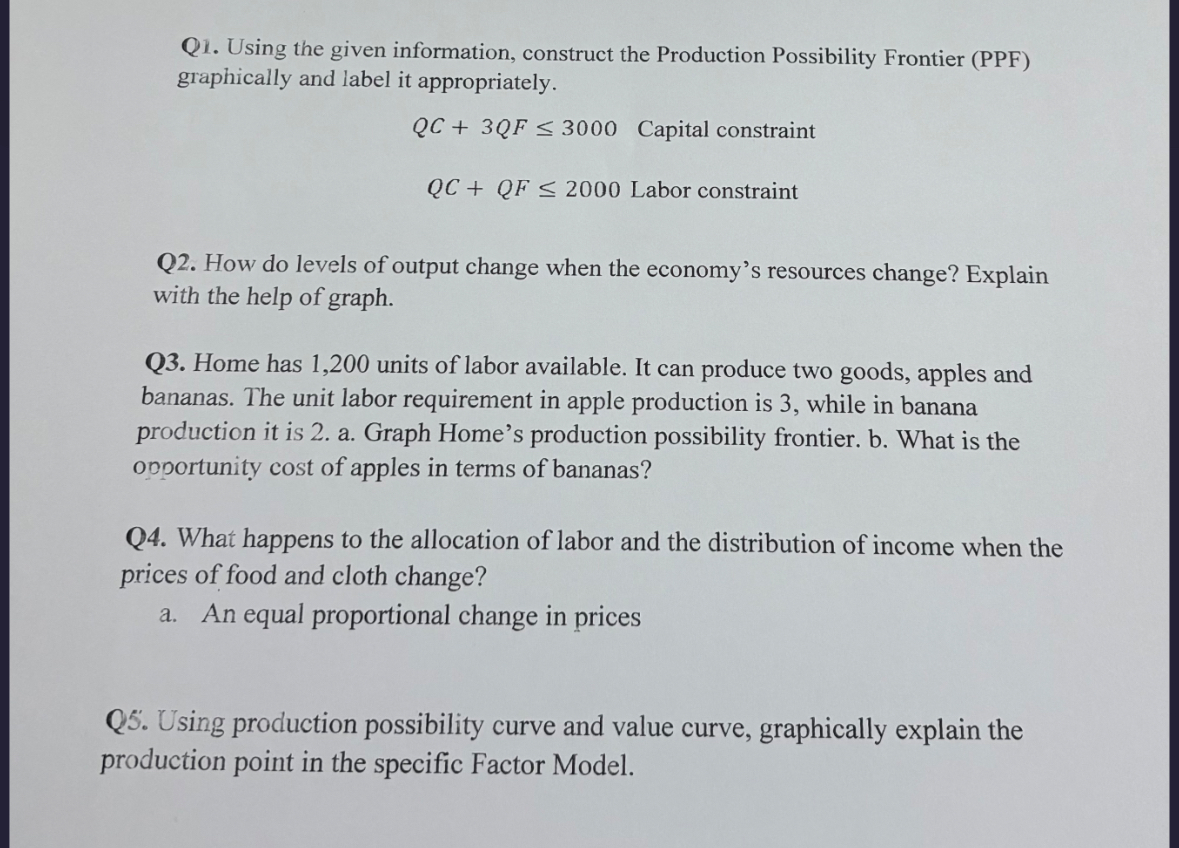
Q Using the given information, construct the Production Possibility Frontier PPF graphically and label it appropriately.
Capital constraint
Labor constraint
Q How do levels of output change when the economy's resources change? Explain with the help of graph.
Q Home has units of labor available. It can produce two goods, apples and bananas. The unit labor requirement in apple production is while in banana production it is a Graph Home's production possibility frontier. b What is the opportunity cost of apples in terms of bananas?
Q What happens to the allocation of labor and the distribution of income when the prices of food and cloth change?
a An equal proportional change in prices
Q Using production possibility curve and value curve, graphically explain the production point in the specific Factor Model.
Step by Step Solution
There are 3 Steps involved in it
1 Expert Approved Answer
Step: 1 Unlock

Question Has Been Solved by an Expert!
Get step-by-step solutions from verified subject matter experts
Step: 2 Unlock
Step: 3 Unlock