

Question: how to solve Problem 19 Intro The table below shows the historical rates of return (including dividends) for two stocks: Year Stock A Stock B
 how to solve
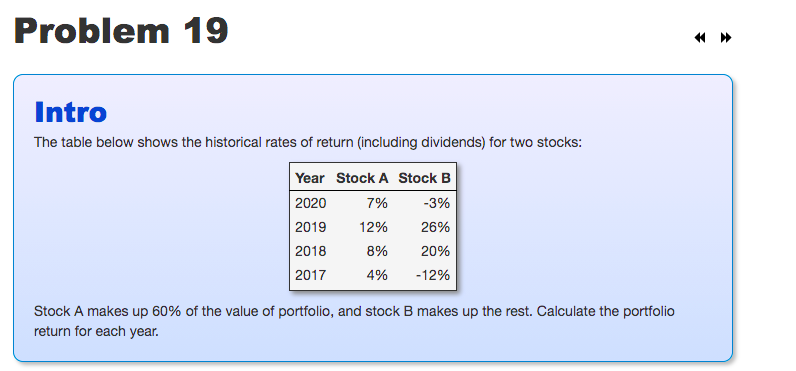
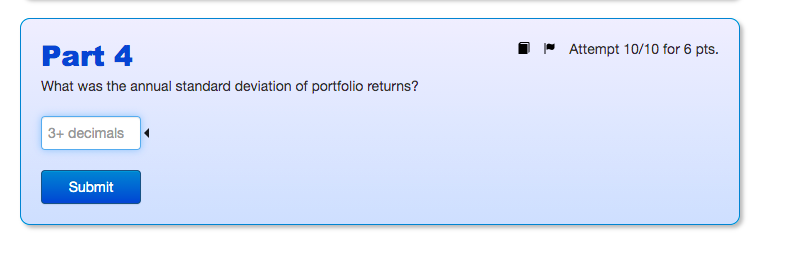
Problem 19 Intro The table below shows the historical rates of return (including dividends) for two stocks: Year Stock A Stock B 2020 7% -3% 2019 12% 26% 2018 8% 20% 2017 -12% 4% Stock A makes up 60% of the value of portfolio, and stock B makes up the rest. Calculate the portfolio return for each year. Attempt 10/10 for 6 pts. Part 4 What was the annual standard deviation of portfolio returns? 3+ decimals Submit
Step by Step Solution
There are 3 Steps involved in it
1 Expert Approved Answer
Step: 1 Unlock

Question Has Been Solved by an Expert!
Get step-by-step solutions from verified subject matter experts
Step: 2 Unlock
Step: 3 Unlock