

Question: How to solve the problem like this? I got the error message when I was trying to forecast the ar3 I created in R. Thank
 How to solve the problem like this? I got the error message when I was trying to forecast the ar3 I created in R. Thank you!
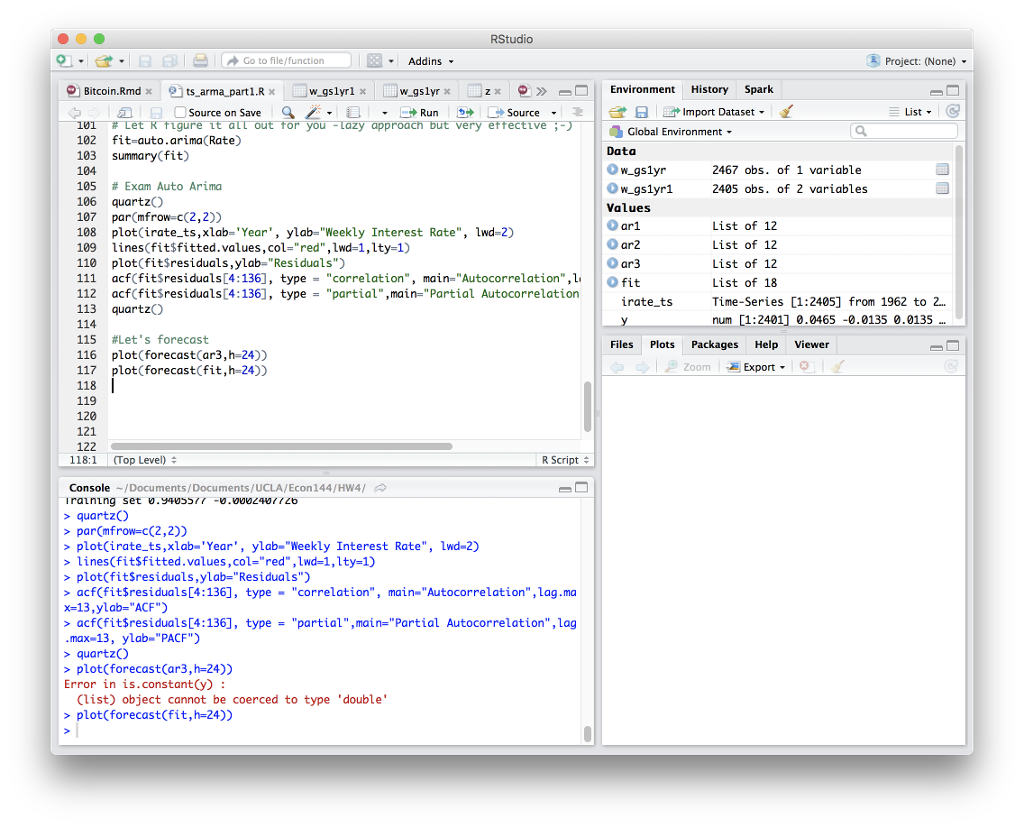
RStudio ?? ??ia 1 Go to file/function Project: (None). Addins Bitcoin.Rmdx ejts-arma-part 1 .R Mgslyr1xlMw-gslyr x -2% | Environment History Spark List 1W1-# L?t K figur??t ?IT ou for you-Lazy?pproach ut very effective ; 102 fit-auto.arima(Rate) 103 summary(fit) 104 105 # Exam Auto Arima 106 quartz) 107 parCmfrow-c(2,2)) 108 plot(irate ts,xlab-'Year', ylab- "Weekly Interest Rate", lwd-2) 109 lines(fit$fitted.values,col-"red" ,lwd-1,lty-1) 110 plot(fitSresiduals,ylab-"Residuals") 111 acfCfitSresiduals[4:136], type "correlation", main-"Autocorrelation",1 112 acf(fit$residuals[4:136], type="partial",main-"Partial Autocorrelation 113 quartzO 114 115 #Let's forecast 116 plot(forecast(ar3,h-24)) 117 plot(forecast(fit,h-24)) 118 119 120 121 122 Environment Data w gslyr 2467 obs. of 1 variable 2405 obs. of 2 variables Values ar1 ar2 ar 3 List of 12 List of 12 List of 12 List of 18 Time-Series [1:2405] from 1962 to 2. num [1:24011 0.0465 -0.01350.0135 Ofit irate ts Files Plots Packages Help Viewer Zoom Export 118:1 (Top Level) R Script Console-/Documents/Documents/UCLA/Econ 144/Hw4/ > quartzO parCmfrow-c(2,2)) plot(irate_ts,xlab-'Year', ylab"Weekly Interest Rate", lwd-2) > lines(fitSfitted.values,col-"red" ,Lwd-1,lty-1) plot(fitSresiduals,ylab-"Residuals") acf(fitSresiduals[4:136], type- "correlation", main-"Autocorrelation",lag.ma x-13,ylab="ACF") acf(fitSresiduals[4:136], type - "partial",main-"Partial Autocorrelation", lag max-13, ylab- "PACF") quartzO plot(forecast(ar3,h-24)) Error in is.constant(y: (list) object cannot be coerced to type "double' plot(forecast(fit,h-24)) RStudio ?? ??ia 1 Go to file/function Project: (None). Addins Bitcoin.Rmdx ejts-arma-part 1 .R Mgslyr1xlMw-gslyr x -2% | Environment History Spark List 1W1-# L?t K figur??t ?IT ou for you-Lazy?pproach ut very effective ; 102 fit-auto.arima(Rate) 103 summary(fit) 104 105 # Exam Auto Arima 106 quartz) 107 parCmfrow-c(2,2)) 108 plot(irate ts,xlab-'Year', ylab- "Weekly Interest Rate", lwd-2) 109 lines(fit$fitted.values,col-"red" ,lwd-1,lty-1) 110 plot(fitSresiduals,ylab-"Residuals") 111 acfCfitSresiduals[4:136], type "correlation", main-"Autocorrelation",1 112 acf(fit$residuals[4:136], type="partial",main-"Partial Autocorrelation 113 quartzO 114 115 #Let's forecast 116 plot(forecast(ar3,h-24)) 117 plot(forecast(fit,h-24)) 118 119 120 121 122 Environment Data w gslyr 2467 obs. of 1 variable 2405 obs. of 2 variables Values ar1 ar2 ar 3 List of 12 List of 12 List of 12 List of 18 Time-Series [1:2405] from 1962 to 2. num [1:24011 0.0465 -0.01350.0135 Ofit irate ts Files Plots Packages Help Viewer Zoom Export 118:1 (Top Level) R Script Console-/Documents/Documents/UCLA/Econ 144/Hw4/ > quartzO parCmfrow-c(2,2)) plot(irate_ts,xlab-'Year', ylab"Weekly Interest Rate", lwd-2) > lines(fitSfitted.values,col-"red" ,Lwd-1,lty-1) plot(fitSresiduals,ylab-"Residuals") acf(fitSresiduals[4:136], type- "correlation", main-"Autocorrelation",lag.ma x-13,ylab="ACF") acf(fitSresiduals[4:136], type - "partial",main-"Partial Autocorrelation", lag max-13, ylab- "PACF") quartzO plot(forecast(ar3,h-24)) Error in is.constant(y: (list) object cannot be coerced to type "double' plot(forecast(fit,h-24))
Step by Step Solution
There are 3 Steps involved in it

Get step-by-step solutions from verified subject matter experts