Question: how to solve the problem? pls show all work, thanks! You work as a supply chain analyst for The Bloom Room, a local flower shop.

how to solve the problem? pls show all work, thanks! how to solve the problem? pls show all work,
You work as a supply chain analyst for The Bloom Room, a local flower shop. The Bloom Room has a physical store in Tempe and also has an online store. In addition to selling flowers to customers at the physical and online stores, The Bloom Room occasionally supplies flowers to nearby grocery stores. The following table details sales for The Bloom Room's flowers over the first six months of the year Jan Feb Bridal Bouquet Lilles 620 Orchids Roses Sunflowers Valentine's Special 590 Mar Apr May Jun. 250190470 500 810 900 680 775 650 700 1600 1400 1500 1450 175 300350 1430 0 440 440 800 600 1500 220 0 270 720 675 2000 200 1800 O 1. For each product, calculate how many units were sold across six months, and calculate the percentage of total sales that each product represents (round to 2 decimal places). %age of Total Sales Sales Bridal Bouquet Lilies Orchids Roses Sunflowers Valentine's Special 2. If a distribution of products and their sales was drawn, identify a flower that would belong to the "head" of the distribution. Also, identify a flower that would belong to the "tall" of the distribution. 3. During which month did The Bloom Room sell the most flowers, and what were the sales for that month? 4. During which month did The Bloom Room sell the least flowers, and what were the sales for that month

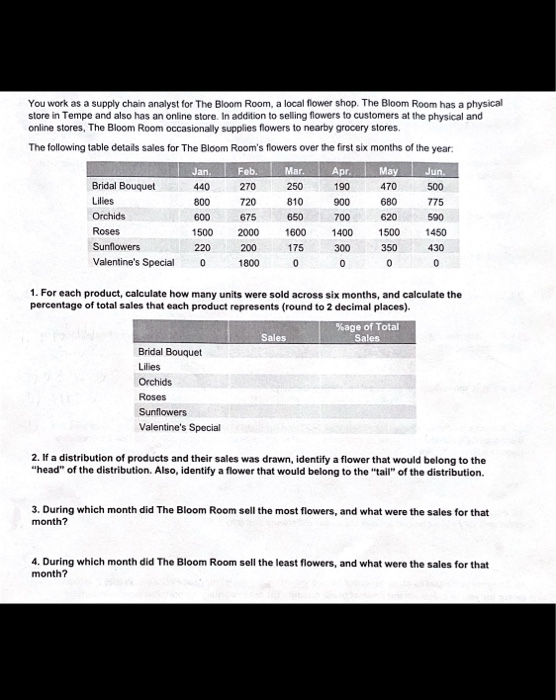
Step by Step Solution

There are 3 Steps involved in it

1 Expert Approved Answer
Step: 1 Unlock blur-text-image
Question Has Been Solved by an Expert!

Get step-by-step solutions from verified subject matter experts

Step: 2 Unlock
Step: 3 Unlock

Students Have Also Explored These Related General Management Questions!