

Question: How to solve the simulation using @Risk In this assignment I would like your team to take the @RISK spreadsheet model megatron.xlsx provided to you
How to solve the simulation using @Risk
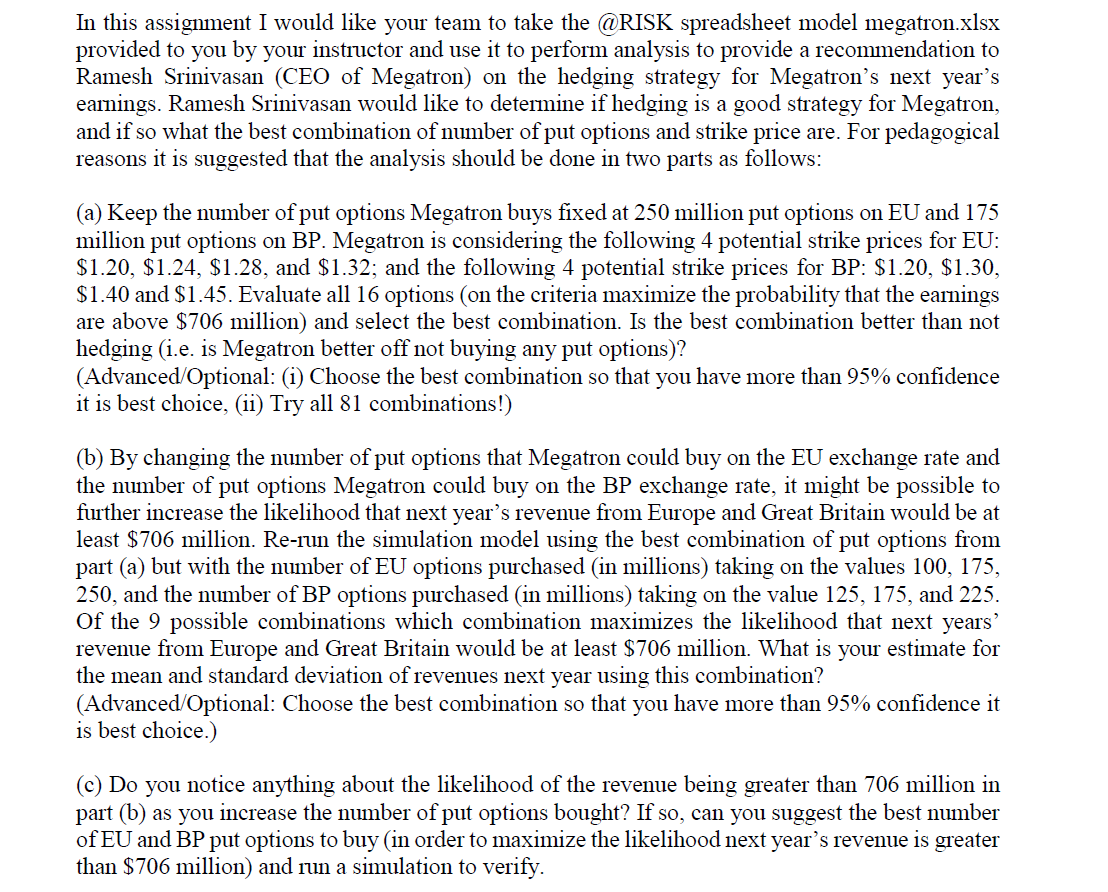
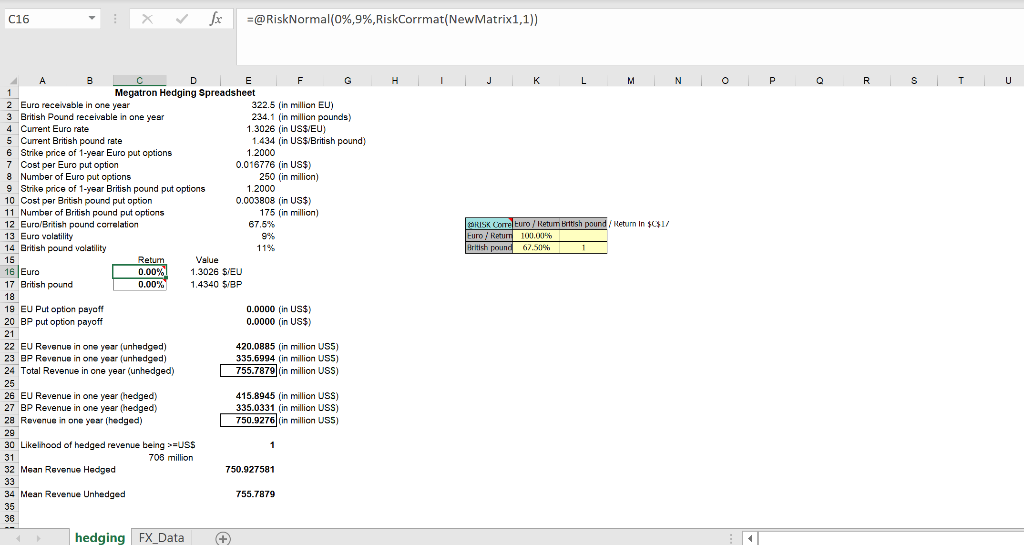
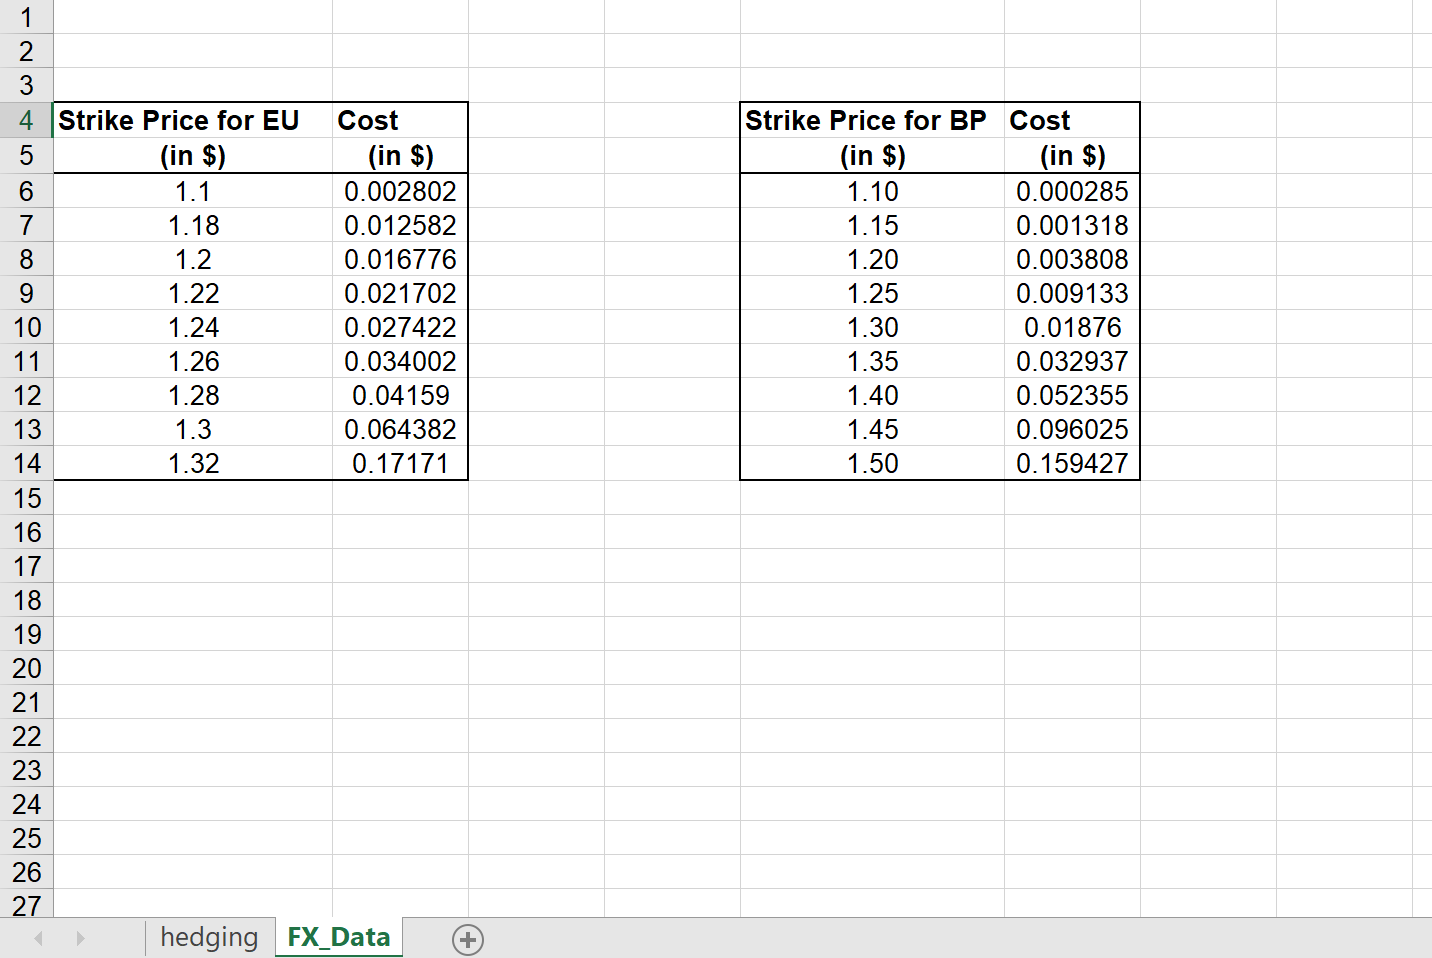
In this assignment I would like your team to take the @RISK spreadsheet model megatron.xlsx provided to you by your instructor and use it to perform analysis to provide a recommendation to Ramesh Srinivasan (CEO of Megatron) on the hedging strategy for Megatron's next year's earnings. Ramesh Srinivasan would like to determine if hedging is a good strategy for Megatron, and if so what the best combination of number of put options and strike price are. For pedagogical reasons it is suggested that the analysis should be done in two parts as follows: (a) Keep the number of put options Megatron buys fixed at 250 million put options on EU and 175 million put options on BP. Megatron is considering the following 4 potential strike prices for EU: $1.20, $1.24, $1.28, and $1.32; and the following 4 potential strike prices for BP: $1.20, $1.30, $1.40 and $1.45. Evaluate all 16 options (on the criteria maximize the probability that the earnings are above $706 million) and select the best combination. Is the best combination better than not hedging (i.e. is Megatron better off not buying any put options)? (Advanced/Optional: (i) Choose the best combination so that you have more than 95% confidence it is best choice, (ii) Try all 81 combinations!) (b) By changing the number of put options that Megatron could buy on the EU exchange rate and the number of put options Megatron could buy on the BP exchange rate, it might be possible to further increase the likelihood that next year's revenue from Europe and Great Britain would be at least $706 million. Re-run the simulation model using the best combination of put options from part (a) but with the number of EU options purchased (in millions) taking on the values 100, 175, 250, and the number of BP options purchased (in millions) taking on the value 125, 175, and 225. Of the 9 possible combinations which combination maximizes the likelihood that next years' revenue from Europe and Great Britain would be at least $706 million. What is your estimate for the mean and standard deviation of revenues next year using this combination? (Advanced Optional: Choose the best combination so that you have more than 95% confidence it is best choice.) (c) Do you notice anything about the likelihood of the revenue being greater than 706 million in part (b) as you increase the number of put options bought? If so, can you suggest the best number of EU and BP put options to buy (in order to maximize the likelihood next year's revenue is greater than $706 million) and run a simulation to verify. C16 fx =@RiskNormal(0%,9%, RiskCorrmat(New Matrix1,1)) j L M N o F P R S T U CRISK Come Euro / Return tish pound/Neturn In $C$17 Euro / Retur 100.00% British round 62.509 1 B E F G 1 1 Megatron Hedging Spreadsheet 2 Euro receiveble in one year 322.5 (in million EU) 3 British Pound receivable in one year 234.1 (in million pounds) 4 Current Euro rate 1.3026 (in US$/EU) 5 Current British pound rate 1.434 (in US$/British pound) 6 Strike price of 1-year Euro put options 1.2000 7 Cost per Euro put option 0.016776 (in US$) 8 Number of Euro put options 250 (in million) 9 Strike price of 1-year British pound put options 1.2000 10 Cost per British pound put option 0.003808 (in US$) 11 Number of British pound put options 175 (in million) 12 Euro/British pound correlation 67.5% 13 Euro volatility 99 14 British pound volatility 11% 15 Return Value 16 Euro 0.00% 1.302 SEJ 17 British pound 0.00% 1.4340 $/BP 18 19 EU Put option payoff 0.0000 (in US$) 20 BP put option payoff 0.0000 (in US$) 21 22 EU Revenue in one year (unhedged) 420.0885 (in million US5) 23 BP Revenue in one year (unhedged) 335.6994 (in million US5) 24 Total Revenue in one year (unhedged) 755.7879 in million USS) 25 26 EU Revenue in one year (hedged) 415.8945 (in Million USS) 27 BP Revenue in one year (hedged) 335.0331 (in million USS) 2a Revenue in one year (hedged) 750.9276 (in million US5) 29 30 Likelihood of hedged revenue being >=USS 1 31 708 million 32 Mean Revenue Hedged 750.927581 33 34 Mean Revenue Unhedged 755.7879 35 36 hedging FX_Data + Strike Price for BP Cost (in $) (in $) 1.10 0.000285 1.15 0.001318 1.20 0.003808 1.25 0.009133 1.30 0.01876 1.35 0.032937 0.052355 1.45 0.096025 .50 0.159427 1.40 1 2 3 4 Strike Price for EU Cost 5 (in $) (in $) 6 1.1 0.002802 1.18 0.012582 8 1.2 0.016776 9 1.22 0.021702 10 1.24 0.027422 11 1.26 0.034002 12 1.28 0.04159 13 1.3 0.064382 14 32 0.17171 15 16 17 18 19 20 21 22 23 24 25 26 27 hedging FX_Data + In this assignment I would like your team to take the @RISK spreadsheet model megatron.xlsx provided to you by your instructor and use it to perform analysis to provide a recommendation to Ramesh Srinivasan (CEO of Megatron) on the hedging strategy for Megatron's next year's earnings. Ramesh Srinivasan would like to determine if hedging is a good strategy for Megatron, and if so what the best combination of number of put options and strike price are. For pedagogical reasons it is suggested that the analysis should be done in two parts as follows: (a) Keep the number of put options Megatron buys fixed at 250 million put options on EU and 175 million put options on BP. Megatron is considering the following 4 potential strike prices for EU: $1.20, $1.24, $1.28, and $1.32; and the following 4 potential strike prices for BP: $1.20, $1.30, $1.40 and $1.45. Evaluate all 16 options (on the criteria maximize the probability that the earnings are above $706 million) and select the best combination. Is the best combination better than not hedging (i.e. is Megatron better off not buying any put options)? (Advanced/Optional: (i) Choose the best combination so that you have more than 95% confidence it is best choice, (ii) Try all 81 combinations!) (b) By changing the number of put options that Megatron could buy on the EU exchange rate and the number of put options Megatron could buy on the BP exchange rate, it might be possible to further increase the likelihood that next year's revenue from Europe and Great Britain would be at least $706 million. Re-run the simulation model using the best combination of put options from part (a) but with the number of EU options purchased (in millions) taking on the values 100, 175, 250, and the number of BP options purchased (in millions) taking on the value 125, 175, and 225. Of the 9 possible combinations which combination maximizes the likelihood that next years' revenue from Europe and Great Britain would be at least $706 million. What is your estimate for the mean and standard deviation of revenues next year using this combination? (Advanced Optional: Choose the best combination so that you have more than 95% confidence it is best choice.) (c) Do you notice anything about the likelihood of the revenue being greater than 706 million in part (b) as you increase the number of put options bought? If so, can you suggest the best number of EU and BP put options to buy (in order to maximize the likelihood next year's revenue is greater than $706 million) and run a simulation to verify. C16 fx =@RiskNormal(0%,9%, RiskCorrmat(New Matrix1,1)) j L M N o F P R S T U CRISK Come Euro / Return tish pound/Neturn In $C$17 Euro / Retur 100.00% British round 62.509 1 B E F G 1 1 Megatron Hedging Spreadsheet 2 Euro receiveble in one year 322.5 (in million EU) 3 British Pound receivable in one year 234.1 (in million pounds) 4 Current Euro rate 1.3026 (in US$/EU) 5 Current British pound rate 1.434 (in US$/British pound) 6 Strike price of 1-year Euro put options 1.2000 7 Cost per Euro put option 0.016776 (in US$) 8 Number of Euro put options 250 (in million) 9 Strike price of 1-year British pound put options 1.2000 10 Cost per British pound put option 0.003808 (in US$) 11 Number of British pound put options 175 (in million) 12 Euro/British pound correlation 67.5% 13 Euro volatility 99 14 British pound volatility 11% 15 Return Value 16 Euro 0.00% 1.302 SEJ 17 British pound 0.00% 1.4340 $/BP 18 19 EU Put option payoff 0.0000 (in US$) 20 BP put option payoff 0.0000 (in US$) 21 22 EU Revenue in one year (unhedged) 420.0885 (in million US5) 23 BP Revenue in one year (unhedged) 335.6994 (in million US5) 24 Total Revenue in one year (unhedged) 755.7879 in million USS) 25 26 EU Revenue in one year (hedged) 415.8945 (in Million USS) 27 BP Revenue in one year (hedged) 335.0331 (in million USS) 2a Revenue in one year (hedged) 750.9276 (in million US5) 29 30 Likelihood of hedged revenue being >=USS 1 31 708 million 32 Mean Revenue Hedged 750.927581 33 34 Mean Revenue Unhedged 755.7879 35 36 hedging FX_Data + Strike Price for BP Cost (in $) (in $) 1.10 0.000285 1.15 0.001318 1.20 0.003808 1.25 0.009133 1.30 0.01876 1.35 0.032937 0.052355 1.45 0.096025 .50 0.159427 1.40 1 2 3 4 Strike Price for EU Cost 5 (in $) (in $) 6 1.1 0.002802 1.18 0.012582 8 1.2 0.016776 9 1.22 0.021702 10 1.24 0.027422 11 1.26 0.034002 12 1.28 0.04159 13 1.3 0.064382 14 32 0.17171 15 16 17 18 19 20 21 22 23 24 25 26 27 hedging FX_Data +
Step by Step Solution
There are 3 Steps involved in it

Get step-by-step solutions from verified subject matter experts