

Question: How to solve This lab uses data from the Prevention of REnal and Vascular END - stage Disease ( PREVEND ) study, which took place
How to solve
This lab uses data from the Prevention of REnal and Vascular ENDstage Disease PREVEND study, which took place between and in the
Netherlands. Clinical and demographic data for individuals are stored in the textttprevend dataset in the textttibiostat package.
As adults age, cognitive function declines over time; this is largely due to various cerebrovascular and neurodegenerative changes.
The Ruff Figural Fluency Test RFFT is one measure of cognitive function that provides information about cognitive abilities such as planning and
the ability to switch between different tasks. Scores on the RFFT range from to points, where higher scores are indicative of better
cognitive function.
The goal of this lab is to begin exploring the relationship between age and RFFT score in the textttprevend dataset.
Ivspace
Fitting and interpreting a line
The questions in this lab will be based around data from a random sample of $$ individuals from the textttprevend dataset; the sample is
stored as textttprevend samp in the textttoibiostat package.
Run the following code chunk to load the textttprevendsamp dataset.
#load the dataset, copy the following code, without hastag, and run in the console
#install. packagesdevtools
#librarydevtools
#devtools::installgithubOIBiostatoibiostatdata"
libraryoibiostat
dataprevendsamp"
reate a scatterplot of RFFT score textttRFFT and age in years textttAge in textttprevendsamp
plot ggplot prevendsamp, aes Age, RFFT
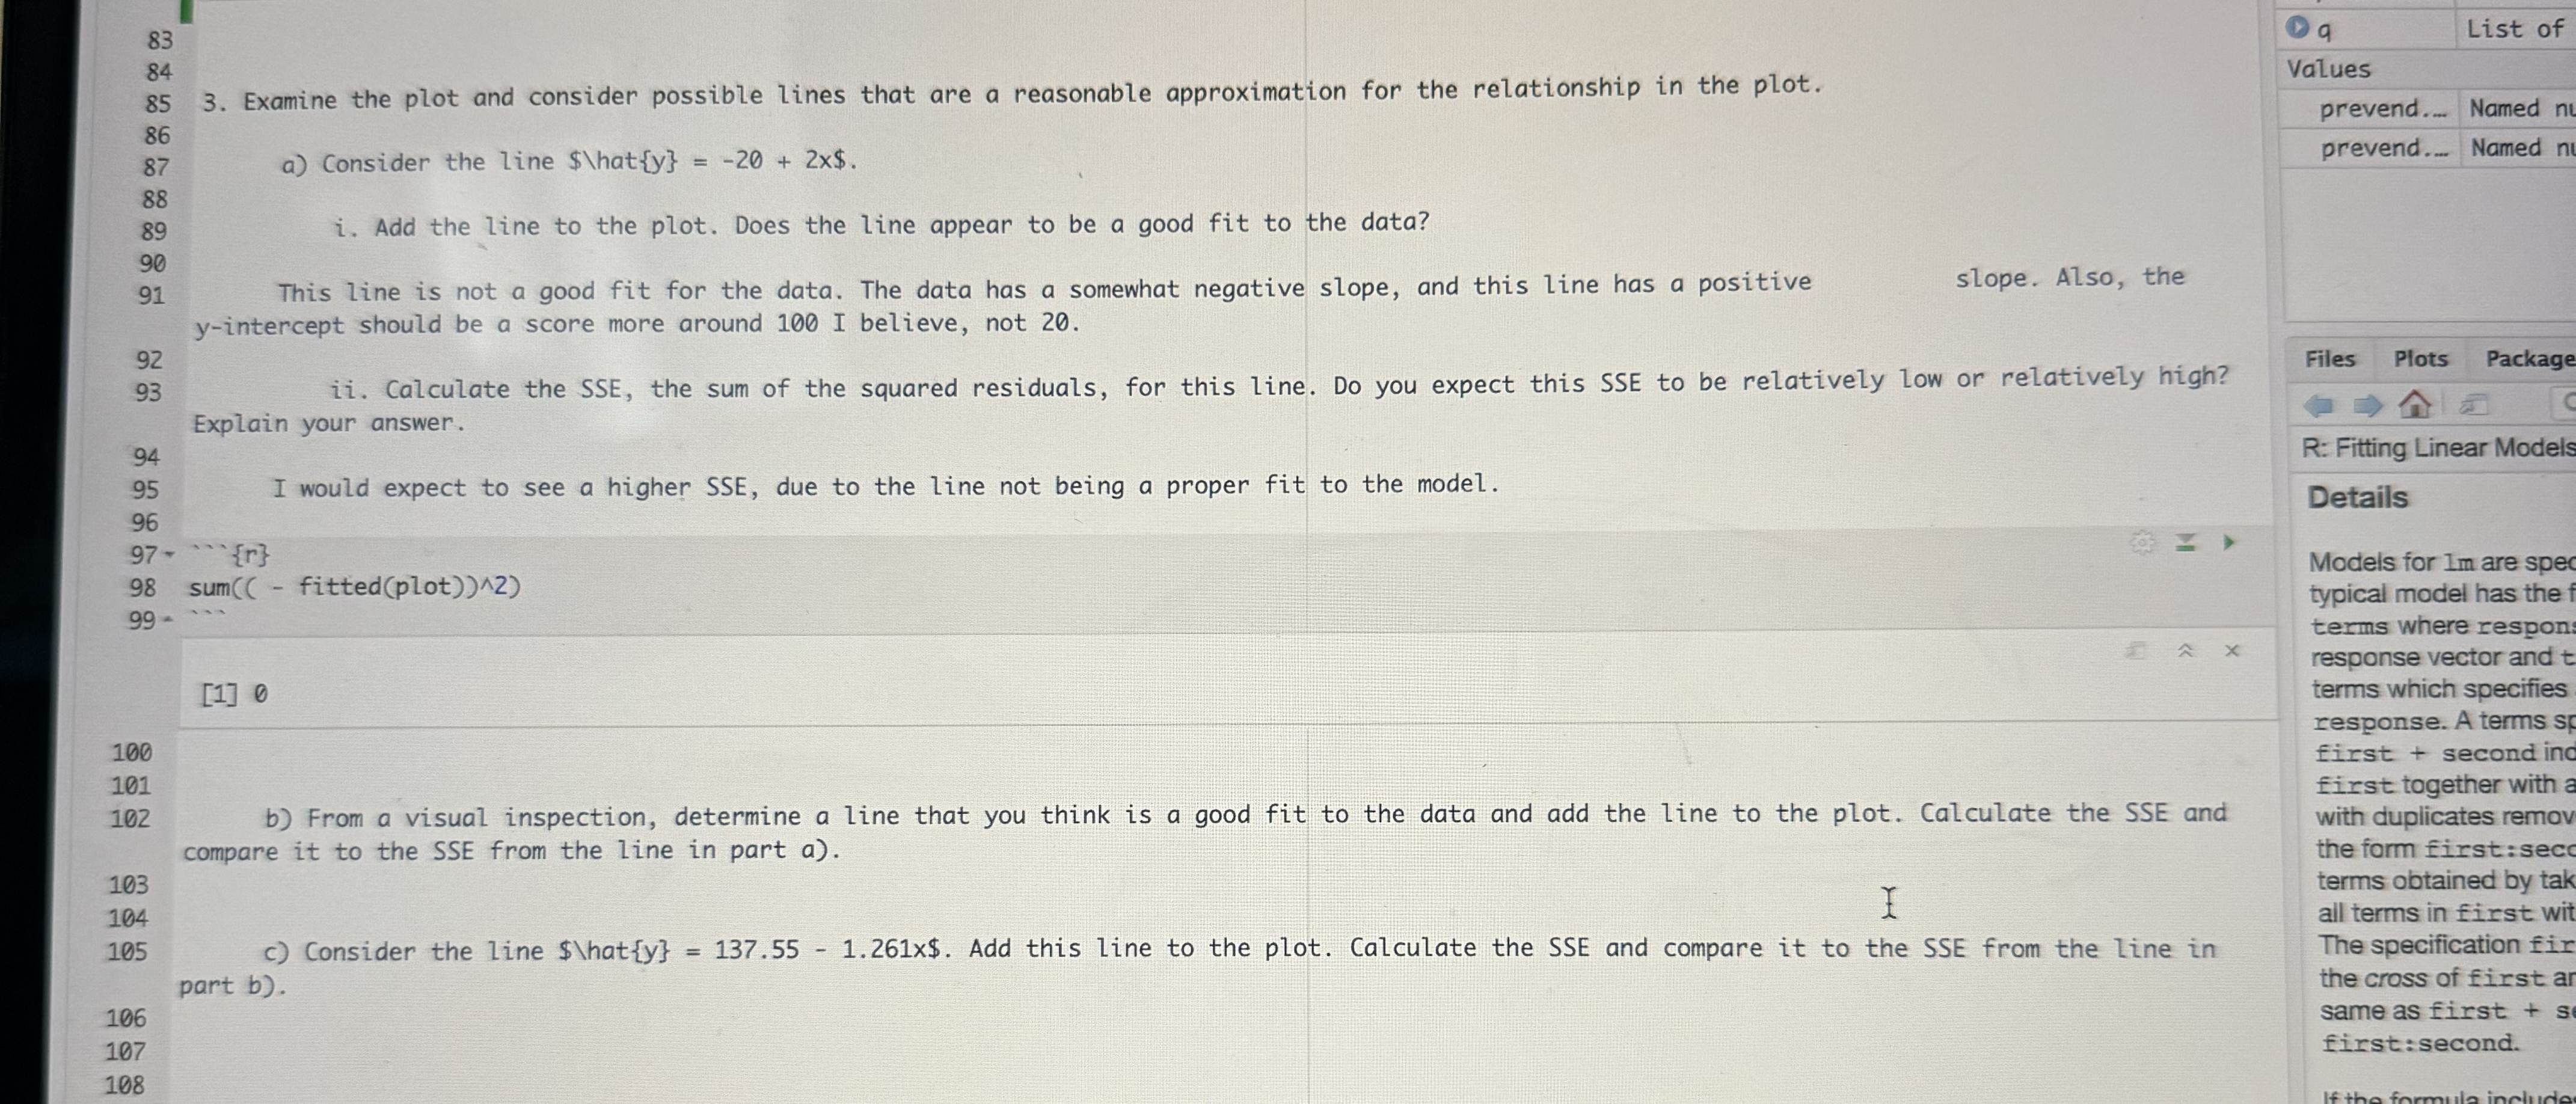
Examine the plot and consider possible lines that are a reasonable approximation for the relationship in the plot.
a Consider the line hat$
i Add the line to the plot. Does the line appear to be a good fit to the data?
This line is not a good fit for the data. The data has a somewhat negative slope, and this line has a positive
slope. Also, the
intercept should be a score more around I believe, not
ii Calculate the SSE, the sum of the squared residuals, for this line. Do you expect this SSE to be relatively low or relatively high?
Explain your answer.
I would expect to see a higher SSE, due to the line not being a proper fit to the model.
fitted
b From a visual inspection, determine a line that you think is a good fit to the data and add the line to the plot. Calculate the SSE and
compare it to the SSE from the line in part
c Consider the line $ hat $ Add this line to the plot. Calculate the SSE and compare it to the SSE from the line in
part b
Step by Step Solution
There are 3 Steps involved in it
1 Expert Approved Answer
Step: 1 Unlock

Question Has Been Solved by an Expert!
Get step-by-step solutions from verified subject matter experts
Step: 2 Unlock
Step: 3 Unlock