

Question: How to solve this question in SPSS please explain like this Mastery Item 6.6 You should verify that approximately 95% of true scores are within
How to solve this question in SPSS

please explain like this
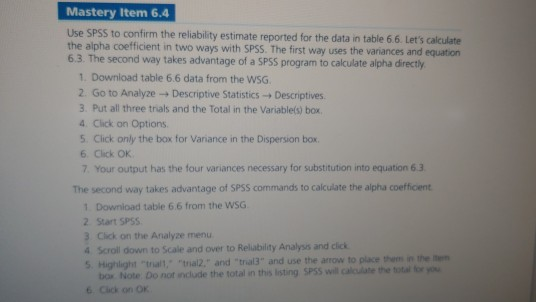
Mastery Item 6.6 You should verify that approximately 95% of true scores are within the range of 420 and 580 when the observed score is 500 and the SEM is 40 points (ie, +2 SEM) @ Mastery Item 6.4 Use SPSS to confirm the reliability estimate reported for the data in table 6.6. Let's calculate the alpha coefficient in two ways with SPSS. The first way uses the variances and equation 6.3. The second way takes advantage of a SPSS program to calculate alpha directly 1. Download table 6.6 data from the WSG 2. Go to Analyze - Descriptive Statistics Descriptives 3. Put all three trials and the Total in the Variable(s) box, 4. Click on Options 5. Click only the box for Variance in the Dispersion box 6. Click OK 7. Your output has the four variances necessary for substitution into equation 6.3 The second way takes advantage of SPSS commands to calculate the alpha coefficient 1 Download table 6.6 from the WSG 2 Start SPSS 3. Click on the Analyze menu 4 Scroll down to scale and over to Reliability Analysis and click 5. Highlight that "thal2." and "tral" and use the arrow to place them in the box Note. Do not include the total in this listing SPSS will calculate the total for you 6. Click on OK Mastery Item 6.6 You should verify that approximately 95% of true scores are within the range of 420 and 580 when the observed score is 500 and the SEM is 40 points (ie, +2 SEM) @ Mastery Item 6.4 Use SPSS to confirm the reliability estimate reported for the data in table 6.6. Let's calculate the alpha coefficient in two ways with SPSS. The first way uses the variances and equation 6.3. The second way takes advantage of a SPSS program to calculate alpha directly 1. Download table 6.6 data from the WSG 2. Go to Analyze - Descriptive Statistics Descriptives 3. Put all three trials and the Total in the Variable(s) box, 4. Click on Options 5. Click only the box for Variance in the Dispersion box 6. Click OK 7. Your output has the four variances necessary for substitution into equation 6.3 The second way takes advantage of SPSS commands to calculate the alpha coefficient 1 Download table 6.6 from the WSG 2 Start SPSS 3. Click on the Analyze menu 4 Scroll down to scale and over to Reliability Analysis and click 5. Highlight that "thal2." and "tral" and use the arrow to place them in the box Note. Do not include the total in this listing SPSS will calculate the total for you 6. Click on OK
Step by Step Solution
There are 3 Steps involved in it

Get step-by-step solutions from verified subject matter experts