

Question: How to write a functionMatlab?First write the matlabsCriptsfunction ( u for the unitstep function, rec for therectangular function andrn for the triangularpulse ) . Matlab
How to write a functionMatlab?First write the matlabsCriptsfunction u for the unitstep function, rec for therectangular function andrn for the triangularpulseMatlab functionE Che unit stepfuncti on y uty t;Example of usecreated::;functionoftheTunctlonxlabel tthe y axisplotlabeltsirs$ abelaxis ie x and yasesqrid on this adcthe grid fot bettermeasurementstitlePlot theunit step functionultt:endMatlab functionrectangular functionfunction y rectMatlab functiotriangular functiorfunetion y trityDt &Use of functions in aseparate mffle& Example of use ofStep functiont:::plot t ut plotxlabel t labelthe xaxisPRACTICEaxis &de finie and yasesuitarid on th is adarhe grid for bettermeasurementsCunerionaxis Exanple of use offunctiont::;plot t rectxlabelt & labethe xaxisylaberectuni stepaxis &de finie x and yasesarLd n & this addthe grid for bettermeasurements,Example of use ofeweat funetiont: :;plot t tritreetheuni stepxlabelt& labethe xaxisylabeELaxis de finie x and yaSesmeasurementsarid on & this addthe grid for betterOt of theGraphical resultsHota tne uni slkp funciion uilAot o the rect. functiotn recyPut of the tri. function recyt &
Exax trec trec tplot tx t linewidth', plot thean t WIth inewi th of size xlabel t label the xaxisylabelxt label the yaxisaxis definie x and y asesgrid on this add the grid for bettermeasurementst:boldnessxgttrittri tuse of rect, functions.o::imisxlabel t & label the xaxistirlenversion:grid on & this add the grid for better: of the functi on xtSPlotting of a function with its trans formedgnal operationsAEtrect it utu t trit:ubpeot to plot graphs on theand yasesplot txt'linewidth', & plot thefunetion xt with linewith of size forv abeltt label the xaxisylabelxt label the y axisaxis definie x and yaseson & this add the grid for bettersrementstitle Plot of the function xtyx t:s ame figureboldnesss ubplot &to plot graphs on theimirsxlabelt & label the xaxisya tirlforkne foraua nd yasesqrid on & this add the grid for betterof the function ytx t
Part :
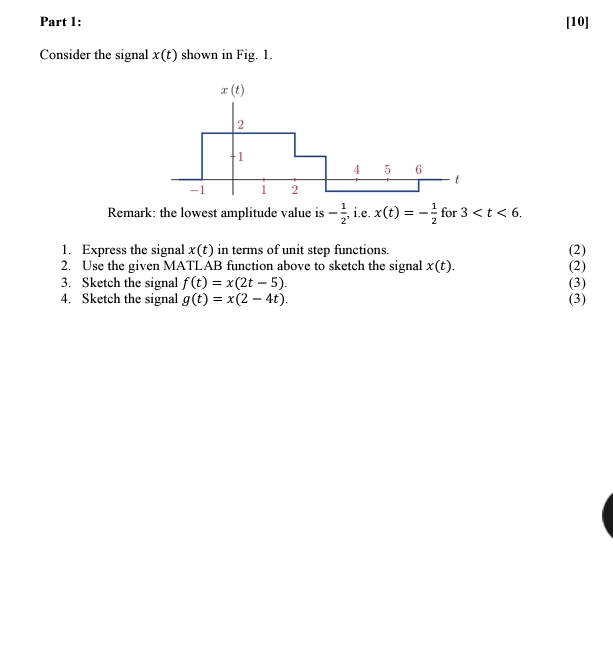
Consider the signal shown in Fig.
Remark: the lowest amplitude value is ie for
Express the signal terms unit step functions.
Use the given MATLAB function above sketch the signal
Sketch the signal
Sketch the signal
Step by Step Solution
There are 3 Steps involved in it
1 Expert Approved Answer
Step: 1 Unlock

Question Has Been Solved by an Expert!
Get step-by-step solutions from verified subject matter experts
Step: 2 Unlock
Step: 3 Unlock