Question: How to write Disciplined capital allocation framework drives our growth and return aspirations =i Recurring capital management - - 6 Sustaining investment Clear disclosure of
How to write
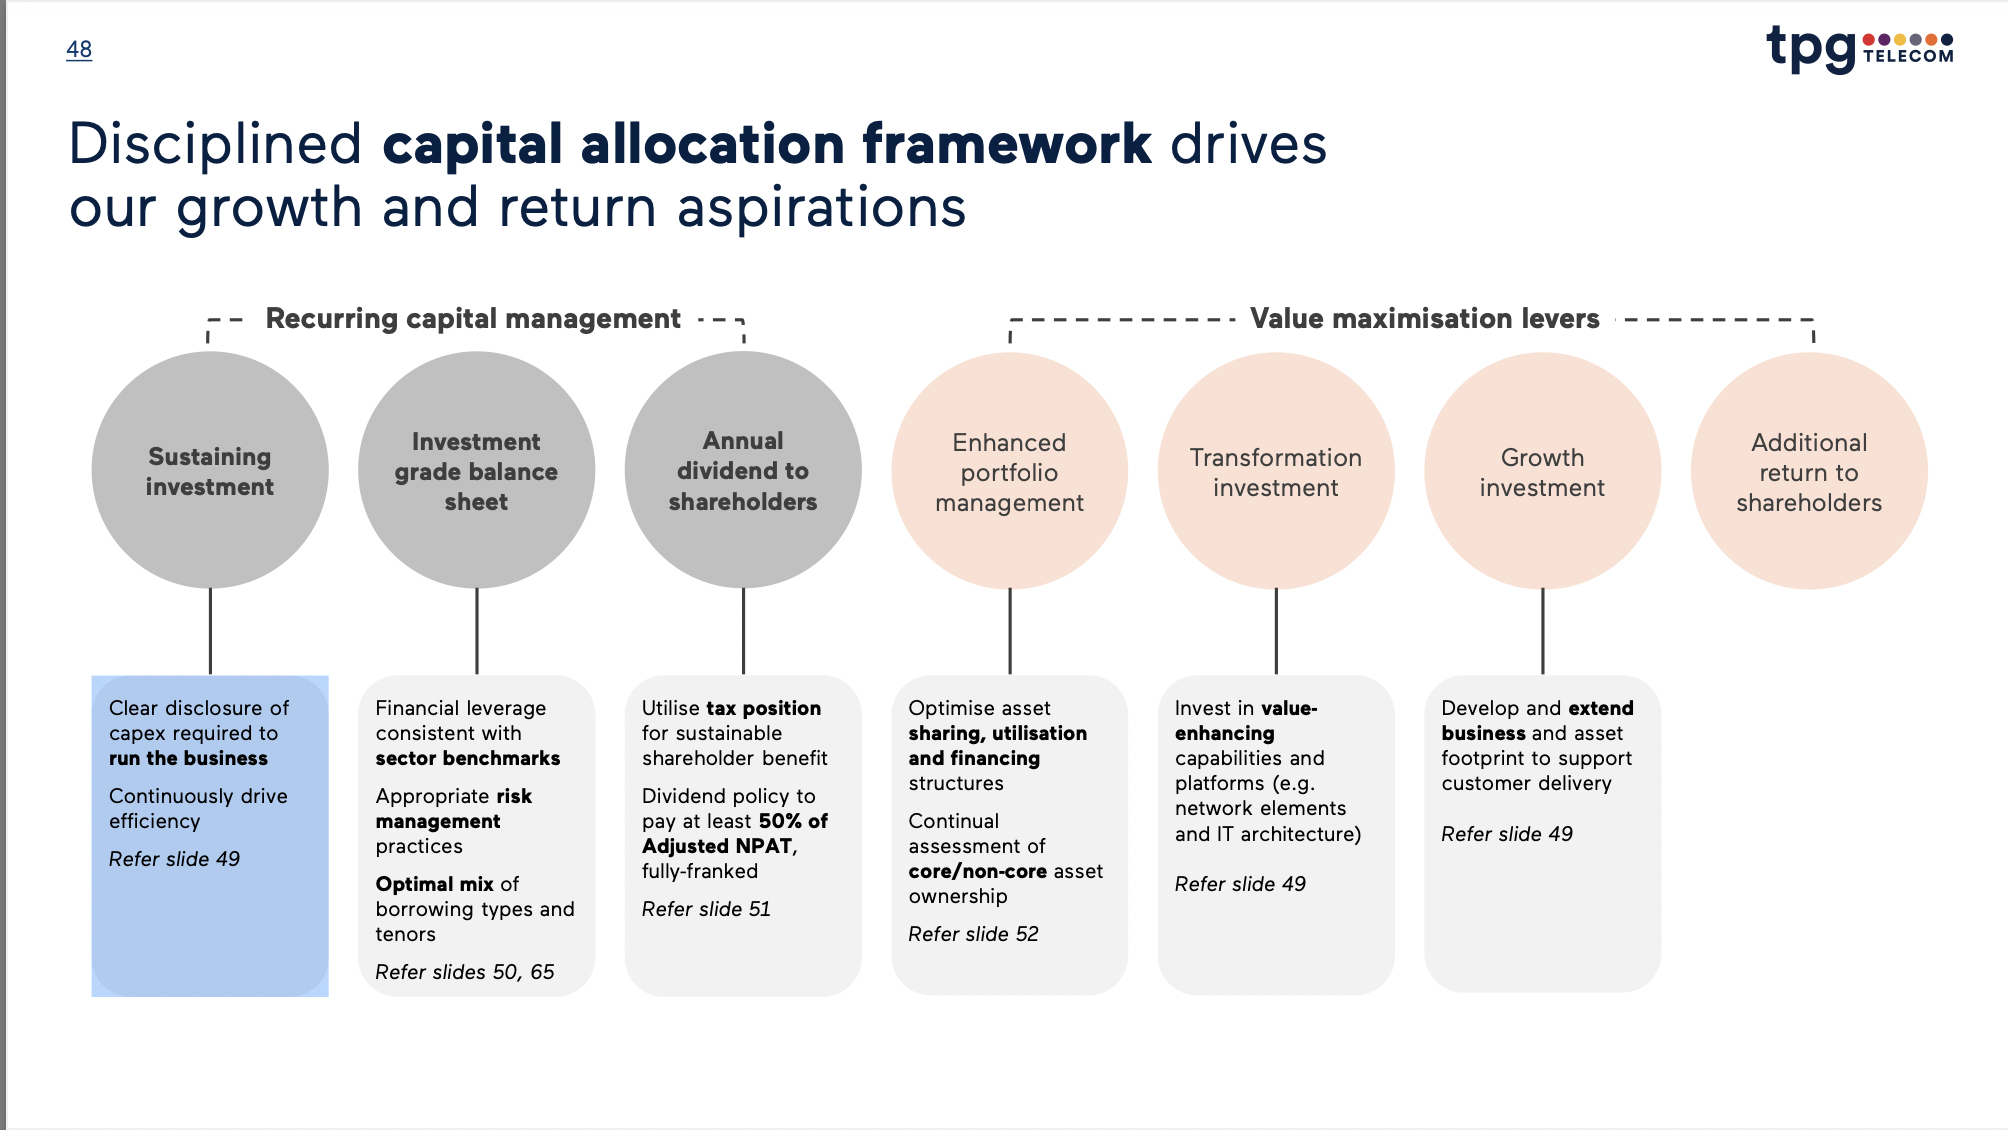
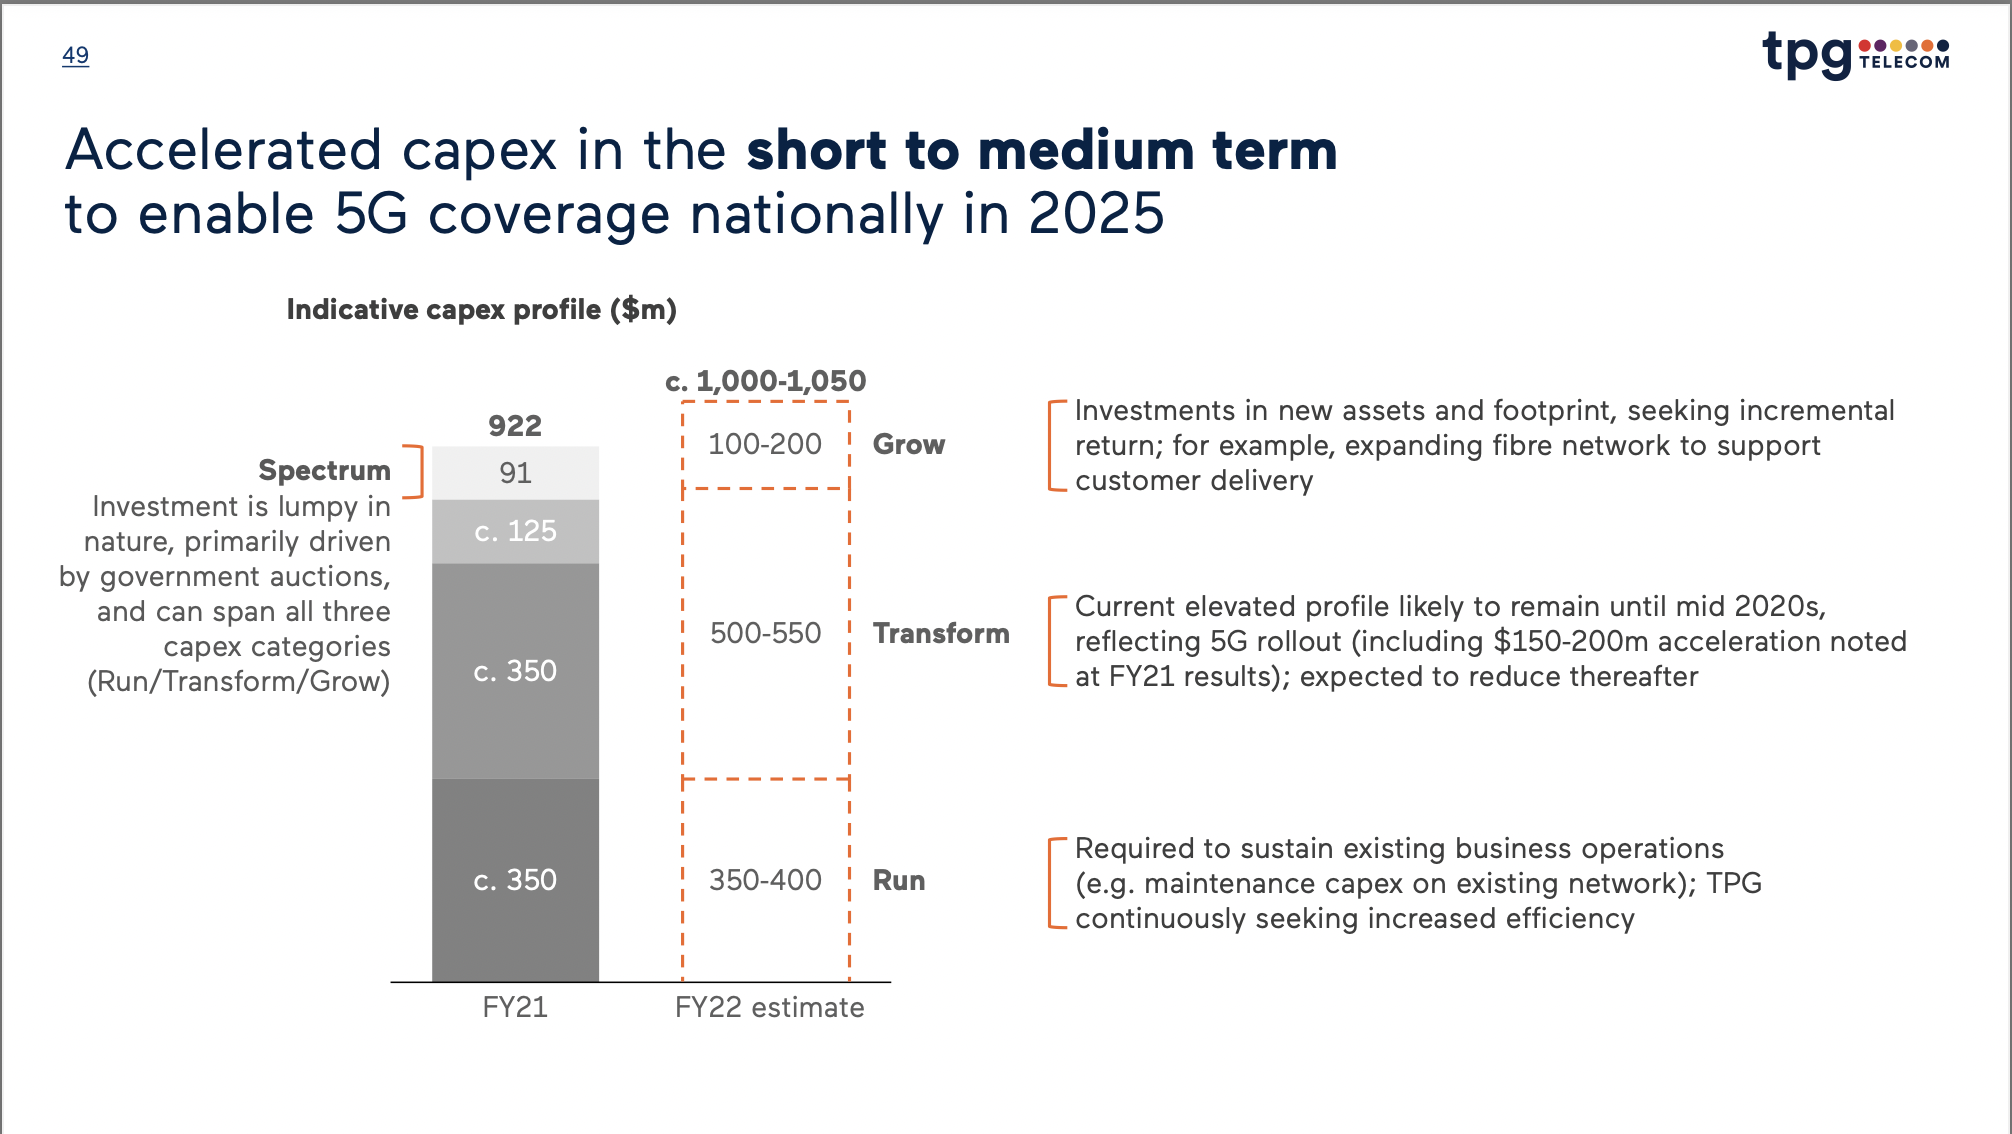
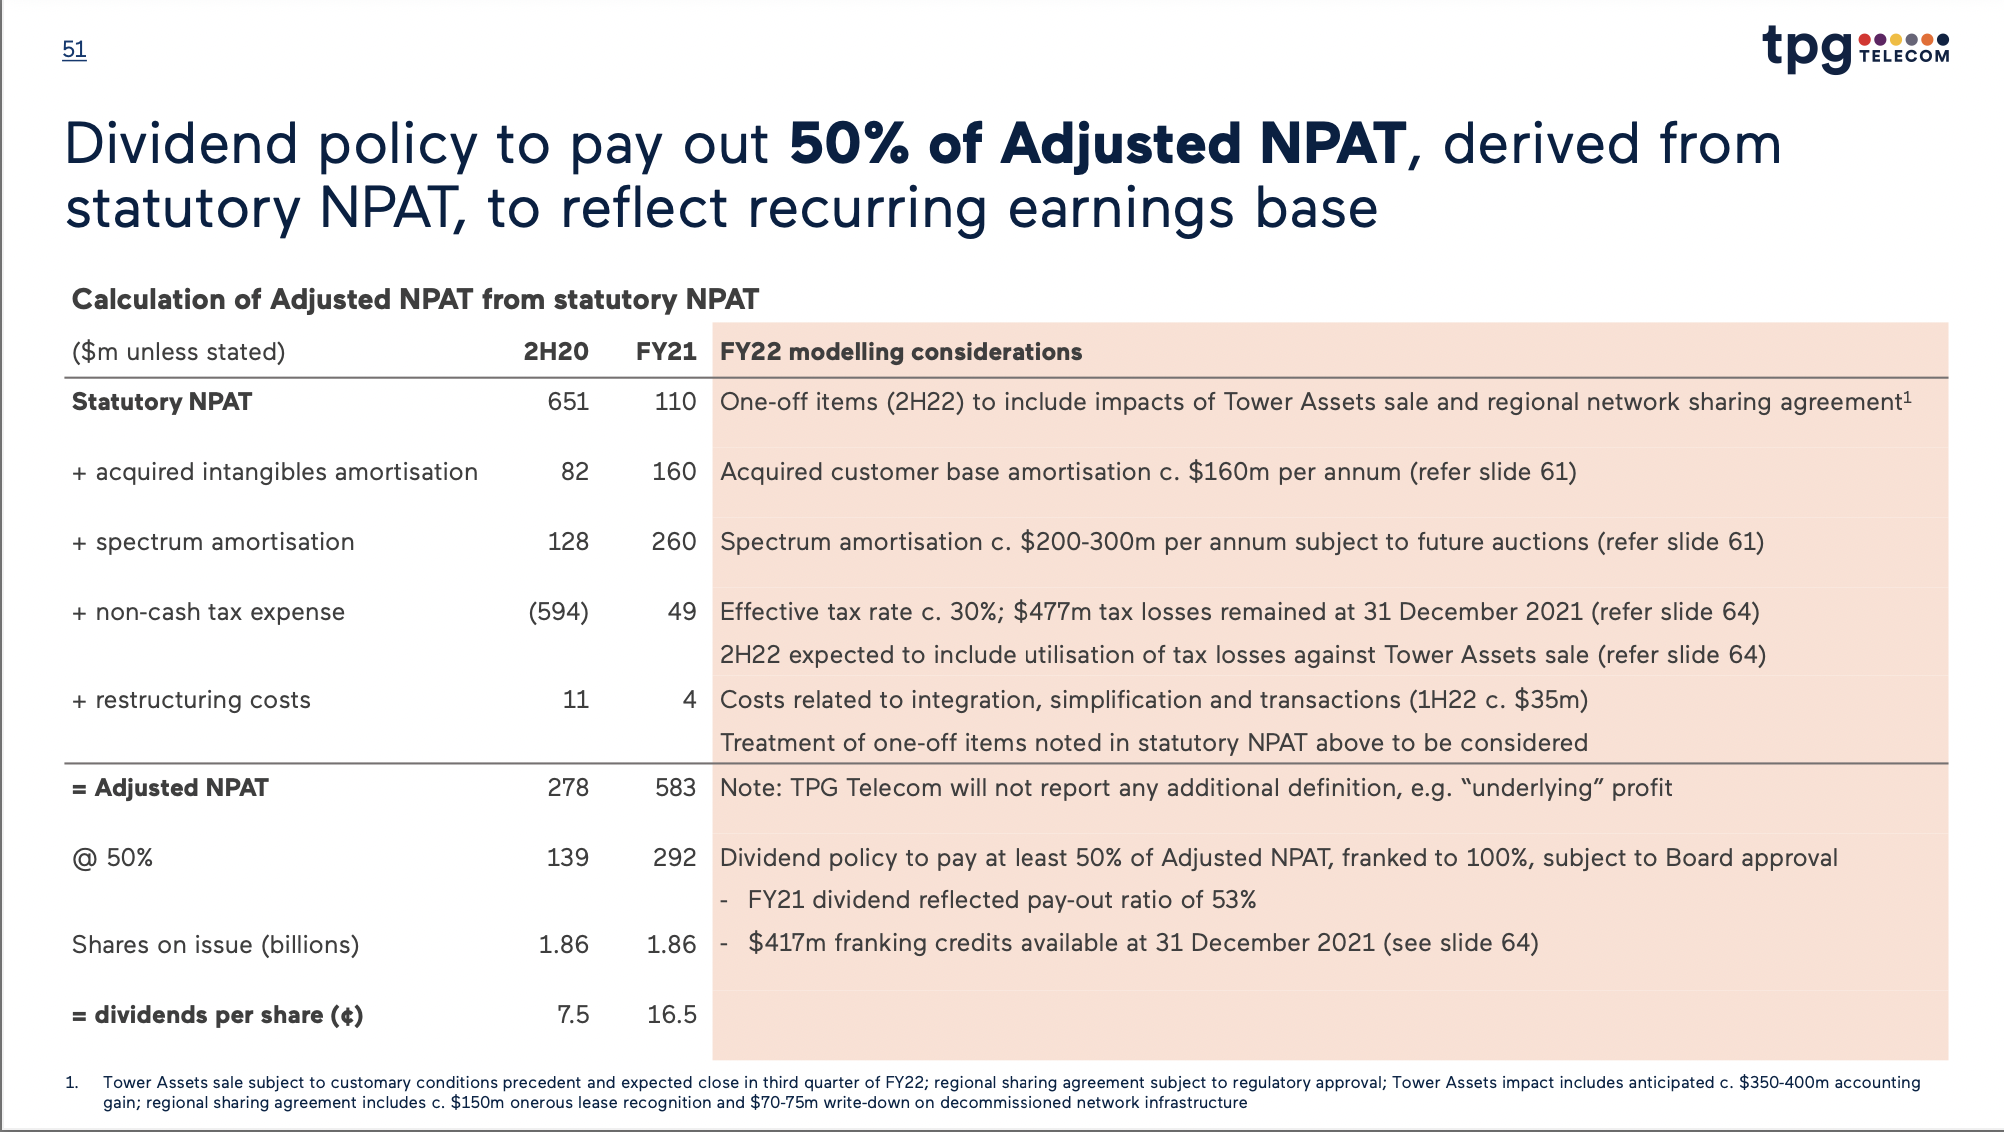
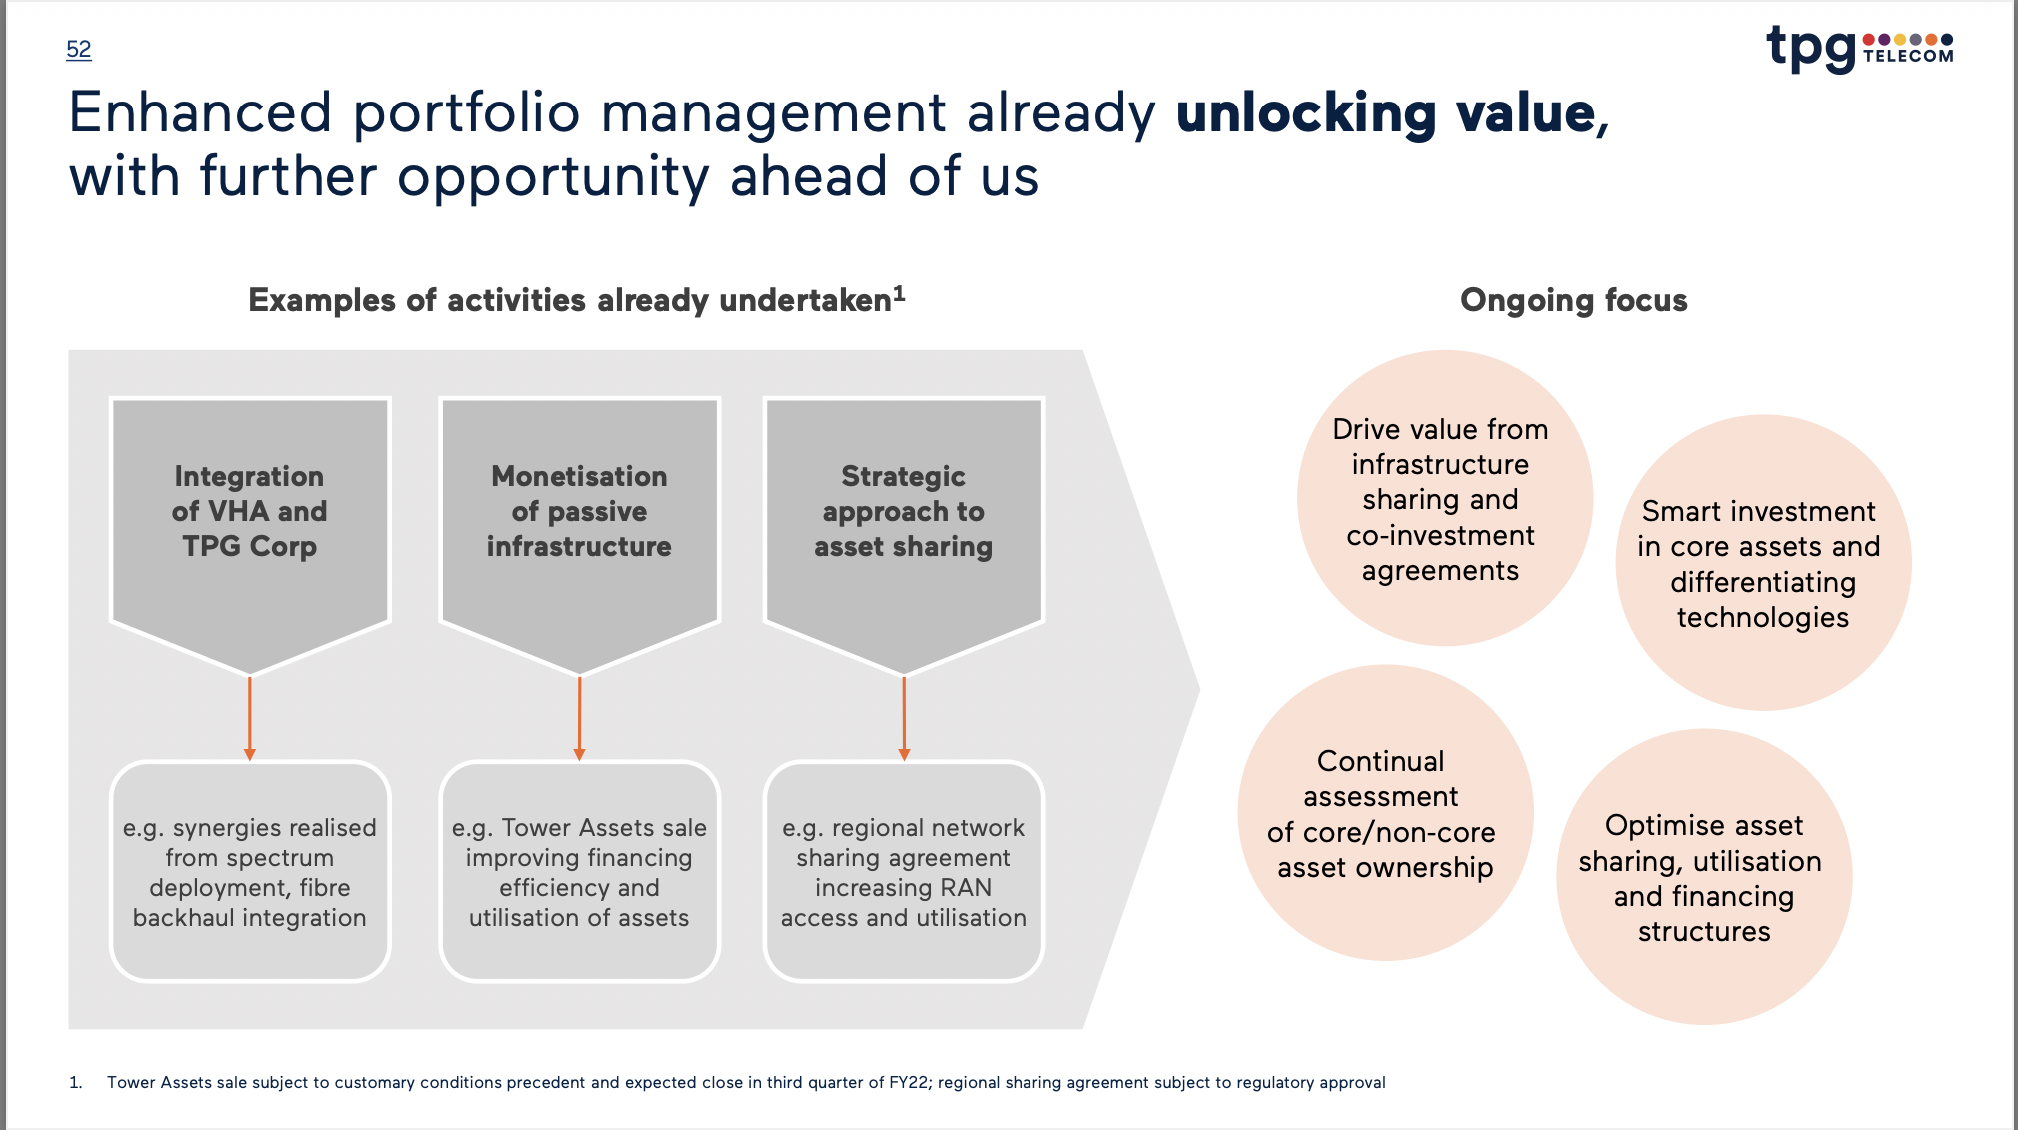
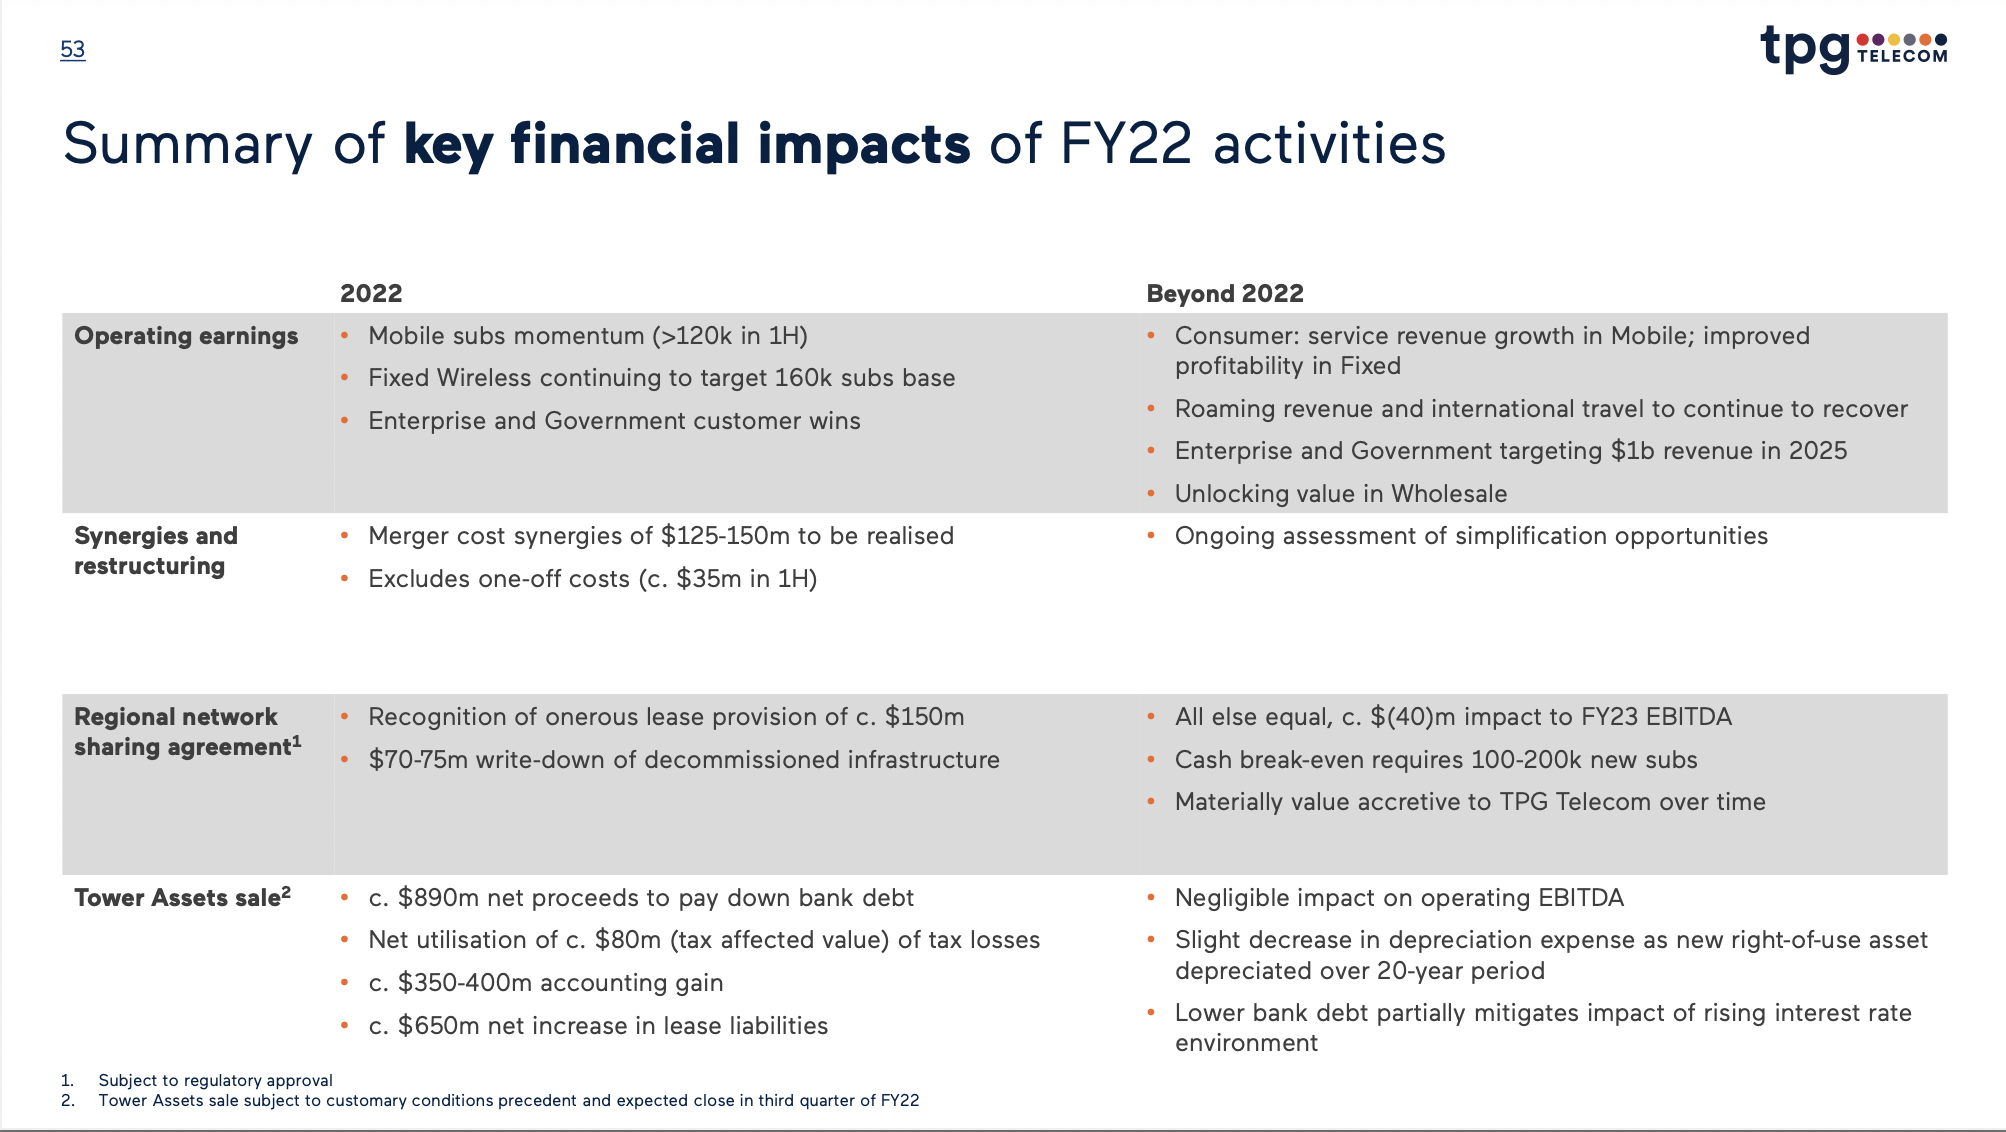
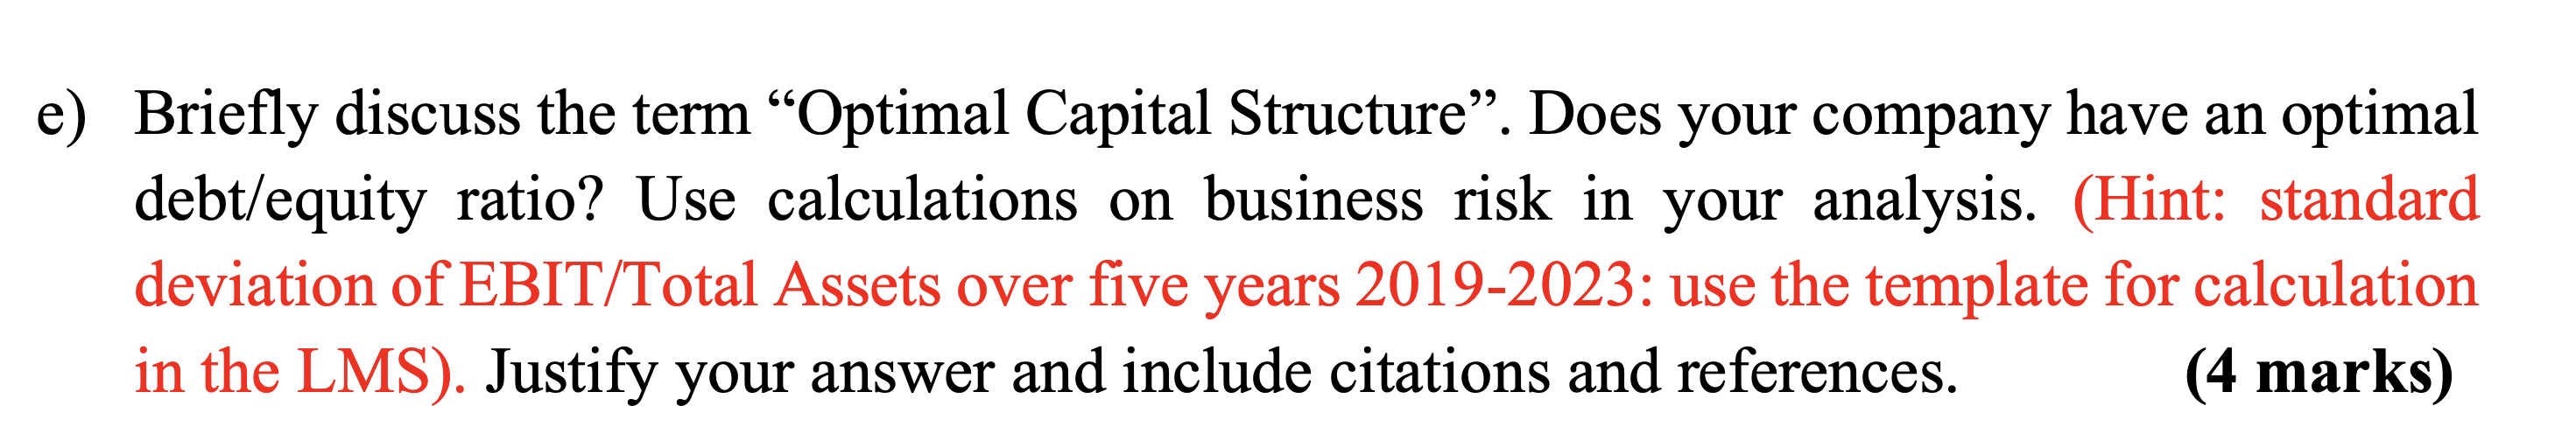
Disciplined capital allocation framework drives our growth and return aspirations =i Recurring capital management - - 6 Sustaining investment Clear disclosure of capex required to run the business Continuously drive efficiency Refer slide 49 Investment grade balance sheet Financial leverage consistent with sector benchmarks Appropriate risk management practices Optimal mix of borrowing types and tenors Refer slides 50, 65 Annual dividend to shareholders Utilise tax position for sustainable shareholder benefit Dividend policy to pay at least 50% of Adjusted NPAT, fully-franked Refer slide 51 Enhanced portfolio management Optimise asset sharing, utilisation and financing structures Continual assessment of coreon-core asset ownership Refer slide 52 Transformation investment Invest in value- enhancing capabilities and platforms (e.g. network elements and IT architecture) Refer slide 49 Growth investment Develop and extend business and asset footprint to support customer delivery Refer slide 49 tpgss:ess Additional return to shareholders a tpgsa:es Accelerated capex in the short to medium term to enable 5G coverage nationally in 2025 Indicative capex profile ($m) c.1,000-1,050 922 i |: Investments in new assets and footprint, seeking incremental 1 1 1 100-200 : Grow return; for example, expanding fibre network to support Spectrum ] 91 ! Investment is lumpy in nature, primarily driven by government auctions, customer delivery continuously seeking increased efficiency t 1 1 1 1 1 1 1 1 and can span all three ! ! Current elevated profile likely to remain until mid 2020s, capex categories ; 500-550 | Transform reflecting 5G rollout (including $150-200m acceleration noted (Run/Transform/Grow) : : at FY21 results); expected to reduce thereafter l | 1 1 F--=---- A 1 1 : : Required to sustain existing business operations | 350-400 | Run (e.g. maintenance capex on existing network); TPG i i 1 1 FY21 FY22 estimate 51 tpg:es Dividend policy to pay out 50% of Adjusted NPAT, derived from statutory NPAT, to reflect recurring earnings base Calculation of Adjusted NPAT from statutory NPAT ($m unless stated) 2H20 FY21 FY22 modelling considerations Statutory NPAT 651 110 One-off items (2H22) to include impacts of Tower Assets sale and regional network sharing agreement? + acquired intangibles amortisation 82 160 Acquired customer base amortisation . $160m per annum (refer slide 61) + spectrum amortisation 128 260 Spectrum amortisation c. $200-300m per annum subject to future auctions (refer slide 61) + non-cash tax expense (594) 49 Effective tax rate c. 30%; $477m tax losses remained at 31 December 2021 (refer slide 64) 2H22 expected to include utilisation of tax losses against Tower Assets sale (refer slide 64) + restructuring costs 1 4 Costs related to integration, simplification and transactions (1H22 c. $35m) Treatment of one-off items noted in statutory NPAT above to be considered = Adjusted NPAT 278 583 Note: TPG Telecom will not report any additional definition, e.g. \"underlying\" profit @ 50% 139 292 Dividend policy to pay at least 50% of Adjusted NPAT, franked to 100%, subject to Board approval - FY21 dividend reflected pay-out ratio of 53% Shares on issue (billions) 1.86 1.86 - $417m franking credits available at 31 December 2021 (see slide 64) = dividends per share () 75 16.5 1. Tower Assets sale subject to customary conditions precedent and expected close in third quarter of FY22; regional sharing agreement subject to regulatory approval; Tower Assets impact includes anticipated c. $350-400m accounting gain; regional sharing agreement includes c. $150m onerous lease recognition and $70-75m write-down on decommissioned network infrastructure 52 tpg ...... TELECOM Enhanced portfolio management already unlocking value, with further opportunity ahead of us Examples of activities already undertaken1 Ongoing focus Drive value from Integration Monetisation Strategic infrastructure of VHA and of passive approach to sharing and Smart investment TPG Corp infrastructure asset sharing co-investment in core assets and agreements differentiating technologies Continual assessment e.g. synergies realised e.g. Tower Assets sale e.g. regional network of coreon-core Optimise asset from spectrum improving financing sharing agreement asset ownership sharing, utilisation deployment, fibre efficiency and increasing RAN and financing backhaul integration utilisation of assets access and utilisation structures 1. Tower Assets sale subject to customary conditions precedent and expected close in third quarter of FY22; regional sharing agreement subject to regulatory approval53 tpgsee Summary of key financial impacts of FY22 activities - Operating earnings Synergies and restructuring Regional network sharing agreement? Tower Assets sale? Subject to regulatory approval 2022 . Mobile subs momentum (>120k in 1H) Fixed Wireless continuing to target 160k subs base Enterprise and Government customer wins Merger cost synergies of $125-150m to be realised Excludes one-off costs (c. $35m in 1H) Recognition of onerous lease provision of c. $150m $70-75m write-down of decommissioned infrastructure c. $890m net proceeds to pay down bank debt Net utilisation of c. $80m (tax affected value) of tax losses c. $350-400m accounting gain c. $650m net increase in lease liabilities Tower Assets sale subject to customary conditions precedent and expected close in third quarter of FY22 Beyond 2022 Consumer: service revenue growth in Mobile; improved profitability in Fixed Roaming revenue and international travel to continue to recover Enterprise and Government targeting $1b revenue in 2025 Unlocking value in Wholesale Ongoing assessment of simplification opportunities All else equal, c. $(40)m impact to FY23 EBITDA Cash break-even requires 100-200k new subs Materially value accretive to TPG Telecom over time Negligible impact on operating EBITDA Slight decrease in depreciation expense as new right-of-use asset depreciated over 20-year period Lower bank debt partially mitigates impact of rising interest rate environment e) Briefly discuss the term \"Optimal Capital Structure\". Does your company have an optimal debt/equity ratio? Use calculations on business risk in your analysis. (Hint: standard deviation of EBIT/Total Assets over five years 2019-2023: use the template for calculation in the LMS). Justify your answer and include citations and references. (4 marks) \f\f
Step by Step Solution
There are 3 Steps involved in it
1 Expert Approved Answer
Step: 1 Unlock
Question Has Been Solved by an Expert!
Get step-by-step solutions from verified subject matter experts
Step: 2 Unlock
Step: 3 Unlock
Students Have Also Explored These Related Accounting Questions!