

Question: How to write the mathematical model for both the objective function and the constrains for this problem in written format. what would be the decision
How to write the mathematical model for both the objective function and the constrains for this problem in written format. what would be the decision variables? (ex. X1,x2,x3)
What insights we should get out of analyzing the sensitivity analysis for both objective function and constrains? 
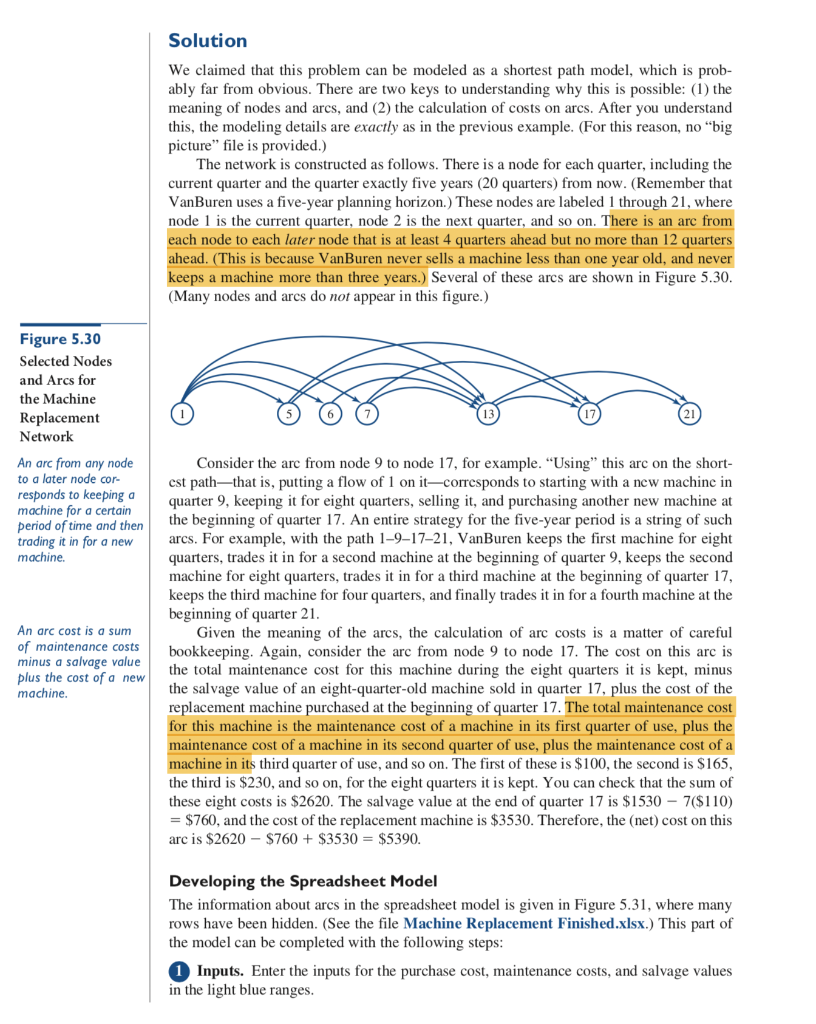
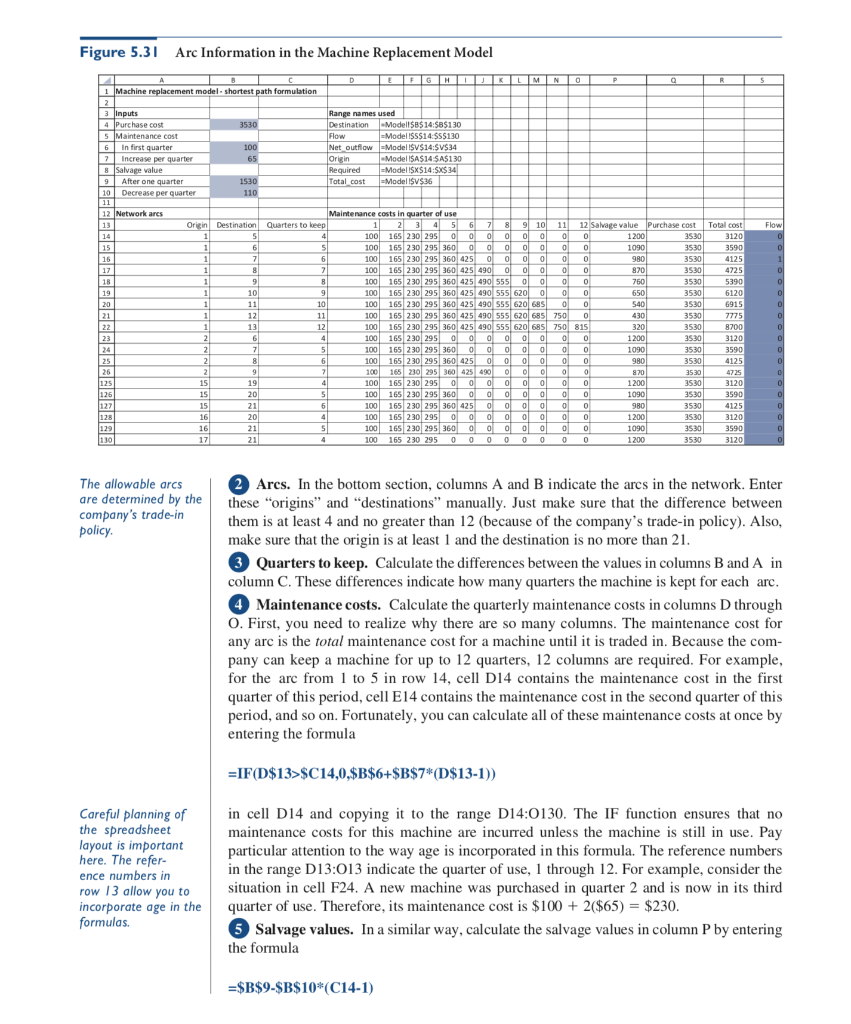
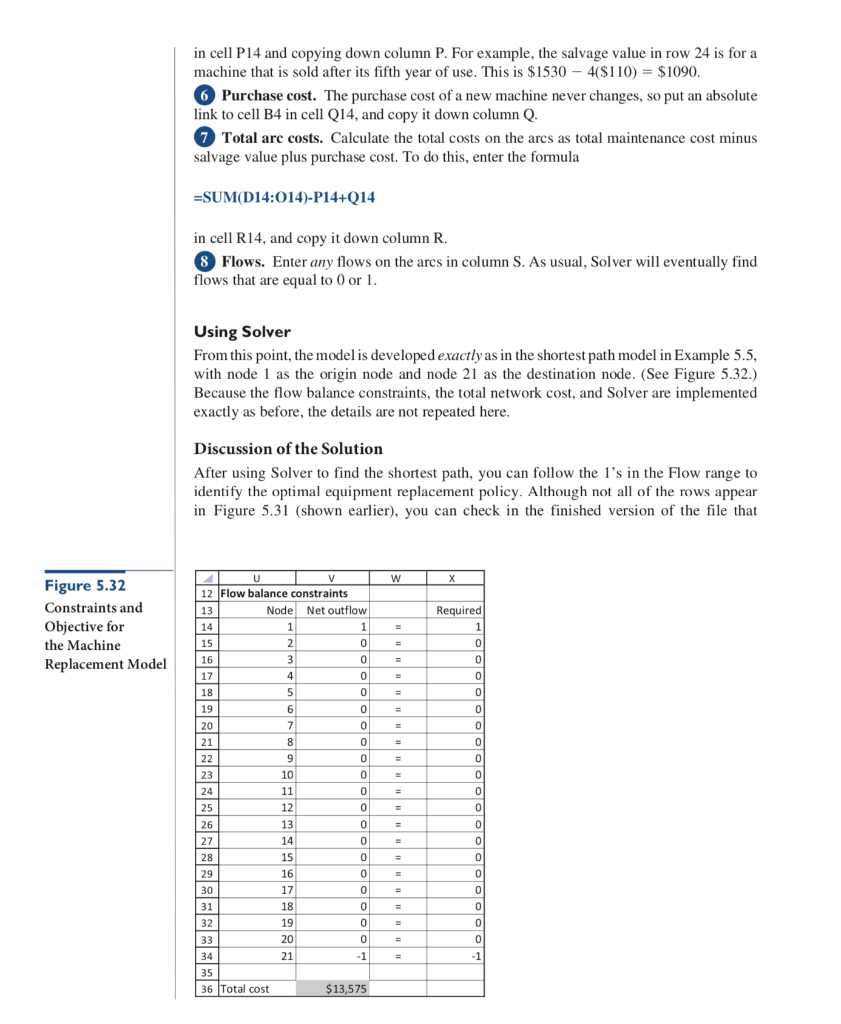
EXAMPLE I 5.6 EQUIPMENT REPLACEMENT AT VAN BUREN METALS anBuren Metals is a manufacturing company that uses many large machines to work on metals. These machines require frequent maintenance because of wear and tear, and VanBuren finds that it is sometimes advantageous, from a cost standpoint, to replace machines rather than continue to maintain them. For one particular class of machines, the company has estimated the quarterly costs of maintenance, the salvage value from reselling an old machine, and the cost to purchase a new machine. We assume that the maintenance cost and the salvage value depend on the age of the current machine (at the beginning of the quarter). However, we assume that the maintenance costs, the salvage values, and the purchase cost do not depend on time. In other words, we assume no inflation. Specifically, we assume the following: The purchase cost of a new machine is always $3530 The maintenance cost of a machine in its first quarter of use is $100. For each suc- ceeding quarter, the maintenance cost increases by $65. This reflects the fact that machines require more maintenance as they age The salvage value of a machine after one quarter of use is $1530. After each suc- ceeding quarter of use, the salvage value decreases by $110 VanBuren wants to devise a strategy for purchasing machines over the next five years As a matter of policy, the company never sells a machine that is less than one year old, and it never keeps a machine that is more than three years old. Also, the machine in use at the beginning of the current quarter is brand new. Objective To find the optimal replacement strategy by modeling the problem as an equivalent shortest path problem Where Do the Numbers Come From? In general, a company would gather historical data on maintenance costs and salvage val ues for similar machines and fit appropriate curves to the data (probably using regression, as discussed in Chapter 13) One issue in these types of models is the time period to use. We assume that VanBuren uses quarters. Therefore the only times it considers purchasing new machines are at beginnings of quarters. Solution We claimed that this problem can be modeled as a shortest path model, which is prob- ably far from obvious. There are two keys to understanding why this is possible: (1) the meaning of nodes and arcs, and (2) the calculation of costs on arcs. After you understand this, the modeling details are exactly as in the previous example. (For this reason, no "big picture" file is provided.) The network is constructed as follows. There is a node for each quarter, including the current quarter and the quarter exactly five years (20 quarters) from now. (Remember that VanBuren uses a five-year planning horizon.) These nodes are labeled 1 through 21, where node 1 is the current quarter, node 2 is the next quarter, and so on. There is an arc from each node to each later node that is at least 4 quarters ahead but no more than 12 quarters ahead. (This is because VanBuren never sells a machine less than one year old, and never keeps a machine more than three years.) Several of these arcs are shown in Figure 5.30 (Many nodes and arcs do not appear in this figure.) Figure 5.30 Selected Nodes and Arcs for the Machine Replacement Network 6 13 17 21 An arc from any node to a later node cor- responds to keeping a machine for a certairn period of time and then Consider the arc from node 9 to node 17, for example. Using, this arc on the short- cst path-that is, putting a flow of 1 on it-corresponds to starting with a new machinc in quarter 9, keeping it for eight quarters, selling it, and purchasing another new machine at the beginning of quarter 17. An entire strategy for the five-year period is a string of such trading it in for a newarcs. For example, with the path 1-9-17-21, VanBuren keeps the first machine for eight quarters, trades it in for a second machine at the beginning of quarter 9, keeps the second machine for eight quarters, trades it in for a third machine at the beginning of quarter 17, keeps the third machine for four quarters, and finally trades it in for a fourth machine at the machine. beginning of quarter 21 An arc cost is a summ Given the meaning of the arcs, the calculation of arc costs is a matter of careful of maintenance costs bookkeeping. Again, consider the arc from node 9 to node 17. The cost on this arc is the total maintenance cost for this machine during the eight quarters it is kept, minus the salvage value of an eight-quarter-old machine sold in quarter 17, plus the cost of the replacement machine purchased at the beginning of quarter 17. The total maintenance cost for this machine is the maintenance cost of a machine in its first quarter of use, plus the maintenance cost of a machine in its second quarter of use, plus the maintenance cost of a machine in its third quarter of use, and so on. The first of these is $100, the second is $165, the third is $230, and so on, for the eight quarters it is kept. You can check that the sum of these eight costs is $2620. The salvage value at the end of quarter 17 is $1530 7$110) -$760, and the cost of the replacement machine is $3530. Therefore, the (net) cost on this minus a salvage value plus the cost of a new machine arc is $2620-$760 + $3530 = $5390. Developing the Spreadsheet Model The information about arcs in the spreadsheet model is given in Figure 5.31, where many rows have been hidden. (See the file Machine Replacement Finished.xlsx.) This part of the model can be completed with the following steps Inputs. Enter the inputs for the purchase cost, maintenance costs, and salvage values in the light blue ranges Figure 5.31 Arc Information in the Machine Replacement Model them is at least 4 and no greater than 12 (because of the company's trade-in policy). Also, make sure that the origin is at least 1 and the destination is no more than 21 Quarters to keep. Calculate the differences between the values in columns B and A in column C. These differences indicate how many quarters the machine is kept for each arc pany can keep a machine for up to 12 quarters, 12 columns are required. For example, entering the formula IF(D$13>$C14,0,$B$6+SB$7 (D$13-1)) particular attention to the way age is incorporated in this formula. The reference numbers incorporate age in the quarter of use. Therefore, its maintenance cost is $100 +2($65) $230 Salvage values. In a similar way, calculate the salvage values in column P by entering -$B$9-SB$10 (C14-1) 9 eon Detent at 2 two nce oli for ns an aus Fo st qu ost 30 30 30 30 30 30 30 30 30 30 30 30 30 30 30 30 30 30 sfp nel 00 nu 3 456789 10 11 12 4567-436-434 114-s6-7-8-90 12 13 15 16 17 18 19 20 21 : 23-24-25-16 25 26 27-28-29-30 in cell P14 and copying down column P. For example, the salvage value in row 24 is for a machine that is sold after its fifth year of use. This is $1530 4($110) $1090 6 Purchase cost. The purchase cost of a new machine never changes, so put an absolute link to cell B4 in cell Q14, and copy it down column Q Total arc costs. Calculate the total costs on the arcs as total maintenance cost minus salvage value plus purchase cost. To do this, enter the formula SUM(D14:014)-P14+Q14 in cell R14, and copy it down column R. 8 Flows. Enter any flows on the arcs in column S. As usual, Solver will eventually find flows that are equal to O or 1 Using Solver From this point, the model is developed exactly as in the shortest path model in Example 5.5, with node 1 as the origin node and node 21 as the destination node. (See Figure 5.32.) Because the flow balance constraints, the total network cost, and Solver are implemented exactly as before, the details are not repeated here Discussion of the Solution After using Solver to find the shortest path, you can follow the 1's in the Flow range to identify the optimal equipment replacement policy. Although not all of the rows appear in Figure 5.31 (shown earlier), you can check in the finished version of the file that Figure 5.32 Constraints and Objective for the Machine Replacement Model 12 Flow balance constraints 13 Node Net outflow uired 16 17 18 19 20 21 0 0 0 10 23 24 25 26 27 28 29 30 31 32 0 12 13 14 15 16 17 18 19 0 0 0 0 21 36 Total cost 13,575 only three arcs have a flow of 1: arcs 1-7, 7-14, and 14-21. This solution indicates that VanBuren should keep the current machine for six quarters, trade it in for a new machine at the beginning of quarter 7, keep the second machine for seven quarters, trade it in for a new machine at the beginning of quarter 14, keep the third machine for seven quarters, and finally trade it in for a new machine at the beginning of quarter 21. The total (net) cost of this strategy is $13,575 Although Solver finds the minimum-cost replacement strategy, this might be a good time for you to try your own strategy, just to make sure you understand how the network works. For example, see if you can enter the appropriate flows for the strategy that replaces the machine in quarters 6, 11, 17, and 21. Your flows should automati- cally satisfy the flow balance constraints, and your total cost should be $14,425. Of course, this is not an optimal solution; its cost is larger than the minimum cost found with Solver Modeling Issues 1. There is no inflation in this model, which means that monetary values do not increase over time. Inflation could certainly be built in, but you would need to esti mate exactly how inflation affects the costs and salvage values, and you would have to build this behavior into the spreadsheet formulas in the model. 2. As the model now stands, VanBuren is forced to resel the current machine and purchase a new one at the end of the five-year period. This is because the cost of every arc leading into the last node, node 21, includes a salvage value and a pur- chase cost. This feature of the model is not as bad as it might seem. Every path from node 1 to node 21 includes the purchase cost in quarter 21, so this cost has no effect on which path is best. The effect of including the salvage value in arcs into node 21 is to penalize strategies that end with old machines after five years. Regardless of how you model the problem, you probably should penalize such strategies in some way. In addiion, VanBuren will probably use a rolling planning horizon-that is, t will implement only short-term decisions from the model. The way you model the end of the five-year horizon should have little effect on these early decisions. . ADDITIONAL APPLICATIONS Periodic Maintenance at Schindler Elevator Schindler, the world's largest escalator company and second-largest elevator company, maintains tens of thousands of elevators and escalators throughoutNorth America Thousands of technicians work each day to maintain, repair, and help in emergencies Blakeley et al. (2003) describe how they developed an automated route-scheduling and planning system to optimize Schindler's preventive maintenance operations. The system uses a series of algorithms to assign maintenance work to technicians and route them to where they are needed. The estimated savings from the optimization system is more than $1 million annually. . EXAMPLE I 5.6 EQUIPMENT REPLACEMENT AT VAN BUREN METALS anBuren Metals is a manufacturing company that uses many large machines to work on metals. These machines require frequent maintenance because of wear and tear, and VanBuren finds that it is sometimes advantageous, from a cost standpoint, to replace machines rather than continue to maintain them. For one particular class of machines, the company has estimated the quarterly costs of maintenance, the salvage value from reselling an old machine, and the cost to purchase a new machine. We assume that the maintenance cost and the salvage value depend on the age of the current machine (at the beginning of the quarter). However, we assume that the maintenance costs, the salvage values, and the purchase cost do not depend on time. In other words, we assume no inflation. Specifically, we assume the following: The purchase cost of a new machine is always $3530 The maintenance cost of a machine in its first quarter of use is $100. For each suc- ceeding quarter, the maintenance cost increases by $65. This reflects the fact that machines require more maintenance as they age The salvage value of a machine after one quarter of use is $1530. After each suc- ceeding quarter of use, the salvage value decreases by $110 VanBuren wants to devise a strategy for purchasing machines over the next five years As a matter of policy, the company never sells a machine that is less than one year old, and it never keeps a machine that is more than three years old. Also, the machine in use at the beginning of the current quarter is brand new. Objective To find the optimal replacement strategy by modeling the problem as an equivalent shortest path problem Where Do the Numbers Come From? In general, a company would gather historical data on maintenance costs and salvage val ues for similar machines and fit appropriate curves to the data (probably using regression, as discussed in Chapter 13) One issue in these types of models is the time period to use. We assume that VanBuren uses quarters. Therefore the only times it considers purchasing new machines are at beginnings of quarters. Solution We claimed that this problem can be modeled as a shortest path model, which is prob- ably far from obvious. There are two keys to understanding why this is possible: (1) the meaning of nodes and arcs, and (2) the calculation of costs on arcs. After you understand this, the modeling details are exactly as in the previous example. (For this reason, no "big picture" file is provided.) The network is constructed as follows. There is a node for each quarter, including the current quarter and the quarter exactly five years (20 quarters) from now. (Remember that VanBuren uses a five-year planning horizon.) These nodes are labeled 1 through 21, where node 1 is the current quarter, node 2 is the next quarter, and so on. There is an arc from each node to each later node that is at least 4 quarters ahead but no more than 12 quarters ahead. (This is because VanBuren never sells a machine less than one year old, and never keeps a machine more than three years.) Several of these arcs are shown in Figure 5.30 (Many nodes and arcs do not appear in this figure.) Figure 5.30 Selected Nodes and Arcs for the Machine Replacement Network 6 13 17 21 An arc from any node to a later node cor- responds to keeping a machine for a certairn period of time and then Consider the arc from node 9 to node 17, for example. Using, this arc on the short- cst path-that is, putting a flow of 1 on it-corresponds to starting with a new machinc in quarter 9, keeping it for eight quarters, selling it, and purchasing another new machine at the beginning of quarter 17. An entire strategy for the five-year period is a string of such trading it in for a newarcs. For example, with the path 1-9-17-21, VanBuren keeps the first machine for eight quarters, trades it in for a second machine at the beginning of quarter 9, keeps the second machine for eight quarters, trades it in for a third machine at the beginning of quarter 17, keeps the third machine for four quarters, and finally trades it in for a fourth machine at the machine. beginning of quarter 21 An arc cost is a summ Given the meaning of the arcs, the calculation of arc costs is a matter of careful of maintenance costs bookkeeping. Again, consider the arc from node 9 to node 17. The cost on this arc is the total maintenance cost for this machine during the eight quarters it is kept, minus the salvage value of an eight-quarter-old machine sold in quarter 17, plus the cost of the replacement machine purchased at the beginning of quarter 17. The total maintenance cost for this machine is the maintenance cost of a machine in its first quarter of use, plus the maintenance cost of a machine in its second quarter of use, plus the maintenance cost of a machine in its third quarter of use, and so on. The first of these is $100, the second is $165, the third is $230, and so on, for the eight quarters it is kept. You can check that the sum of these eight costs is $2620. The salvage value at the end of quarter 17 is $1530 7$110) -$760, and the cost of the replacement machine is $3530. Therefore, the (net) cost on this minus a salvage value plus the cost of a new machine arc is $2620-$760 + $3530 = $5390. Developing the Spreadsheet Model The information about arcs in the spreadsheet model is given in Figure 5.31, where many rows have been hidden. (See the file Machine Replacement Finished.xlsx.) This part of the model can be completed with the following steps Inputs. Enter the inputs for the purchase cost, maintenance costs, and salvage values in the light blue ranges Figure 5.31 Arc Information in the Machine Replacement Model them is at least 4 and no greater than 12 (because of the company's trade-in policy). Also, make sure that the origin is at least 1 and the destination is no more than 21 Quarters to keep. Calculate the differences between the values in columns B and A in column C. These differences indicate how many quarters the machine is kept for each arc pany can keep a machine for up to 12 quarters, 12 columns are required. For example, entering the formula IF(D$13>$C14,0,$B$6+SB$7 (D$13-1)) particular attention to the way age is incorporated in this formula. The reference numbers incorporate age in the quarter of use. Therefore, its maintenance cost is $100 +2($65) $230 Salvage values. In a similar way, calculate the salvage values in column P by entering -$B$9-SB$10 (C14-1) 9 eon Detent at 2 two nce oli for ns an aus Fo st qu ost 30 30 30 30 30 30 30 30 30 30 30 30 30 30 30 30 30 30 sfp nel 00 nu 3 456789 10 11 12 4567-436-434 114-s6-7-8-90 12 13 15 16 17 18 19 20 21 : 23-24-25-16 25 26 27-28-29-30 in cell P14 and copying down column P. For example, the salvage value in row 24 is for a machine that is sold after its fifth year of use. This is $1530 4($110) $1090 6 Purchase cost. The purchase cost of a new machine never changes, so put an absolute link to cell B4 in cell Q14, and copy it down column Q Total arc costs. Calculate the total costs on the arcs as total maintenance cost minus salvage value plus purchase cost. To do this, enter the formula SUM(D14:014)-P14+Q14 in cell R14, and copy it down column R. 8 Flows. Enter any flows on the arcs in column S. As usual, Solver will eventually find flows that are equal to O or 1 Using Solver From this point, the model is developed exactly as in the shortest path model in Example 5.5, with node 1 as the origin node and node 21 as the destination node. (See Figure 5.32.) Because the flow balance constraints, the total network cost, and Solver are implemented exactly as before, the details are not repeated here Discussion of the Solution After using Solver to find the shortest path, you can follow the 1's in the Flow range to identify the optimal equipment replacement policy. Although not all of the rows appear in Figure 5.31 (shown earlier), you can check in the finished version of the file that Figure 5.32 Constraints and Objective for the Machine Replacement Model 12 Flow balance constraints 13 Node Net outflow uired 16 17 18 19 20 21 0 0 0 10 23 24 25 26 27 28 29 30 31 32 0 12 13 14 15 16 17 18 19 0 0 0 0 21 36 Total cost 13,575 only three arcs have a flow of 1: arcs 1-7, 7-14, and 14-21. This solution indicates that VanBuren should keep the current machine for six quarters, trade it in for a new machine at the beginning of quarter 7, keep the second machine for seven quarters, trade it in for a new machine at the beginning of quarter 14, keep the third machine for seven quarters, and finally trade it in for a new machine at the beginning of quarter 21. The total (net) cost of this strategy is $13,575 Although Solver finds the minimum-cost replacement strategy, this might be a good time for you to try your own strategy, just to make sure you understand how the network works. For example, see if you can enter the appropriate flows for the strategy that replaces the machine in quarters 6, 11, 17, and 21. Your flows should automati- cally satisfy the flow balance constraints, and your total cost should be $14,425. Of course, this is not an optimal solution; its cost is larger than the minimum cost found with Solver Modeling Issues 1. There is no inflation in this model, which means that monetary values do not increase over time. Inflation could certainly be built in, but you would need to esti mate exactly how inflation affects the costs and salvage values, and you would have to build this behavior into the spreadsheet formulas in the model. 2. As the model now stands, VanBuren is forced to resel the current machine and purchase a new one at the end of the five-year period. This is because the cost of every arc leading into the last node, node 21, includes a salvage value and a pur- chase cost. This feature of the model is not as bad as it might seem. Every path from node 1 to node 21 includes the purchase cost in quarter 21, so this cost has no effect on which path is best. The effect of including the salvage value in arcs into node 21 is to penalize strategies that end with old machines after five years. Regardless of how you model the problem, you probably should penalize such strategies in some way. In addiion, VanBuren will probably use a rolling planning horizon-that is, t will implement only short-term decisions from the model. The way you model the end of the five-year horizon should have little effect on these early decisions. . ADDITIONAL APPLICATIONS Periodic Maintenance at Schindler Elevator Schindler, the world's largest escalator company and second-largest elevator company, maintains tens of thousands of elevators and escalators throughoutNorth America Thousands of technicians work each day to maintain, repair, and help in emergencies Blakeley et al. (2003) describe how they developed an automated route-scheduling and planning system to optimize Schindler's preventive maintenance operations. The system uses a series of algorithms to assign maintenance work to technicians and route them to where they are needed. The estimated savings from the optimization system is more than $1 million annually
Step by Step Solution
There are 3 Steps involved in it

Get step-by-step solutions from verified subject matter experts