

Question: How was the graph drawn on Excel using the data proved (Rheology)? Please include detailed explanation A capillary rheometer is being used to characterise a
How was the graph drawn on Excel using the data proved (Rheology)? Please include detailed explanation
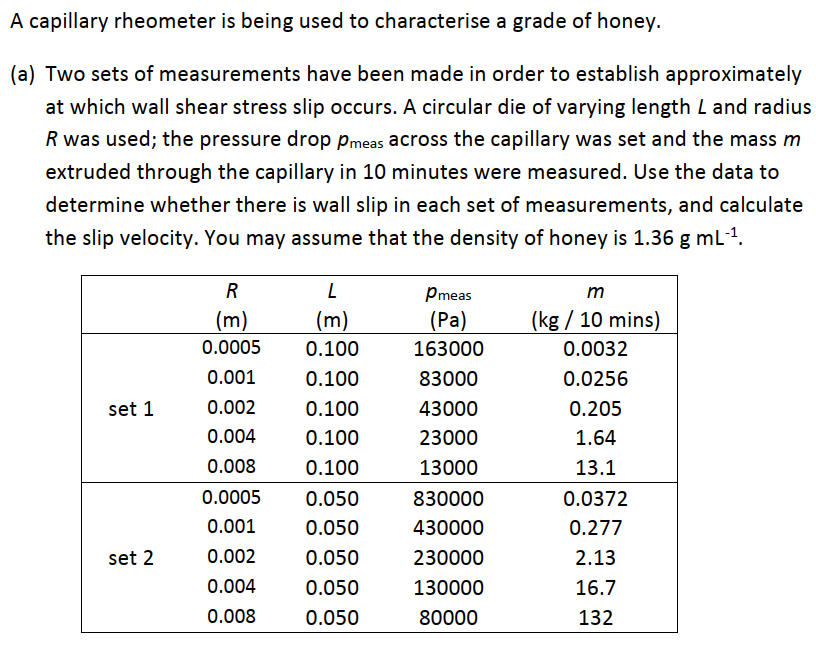
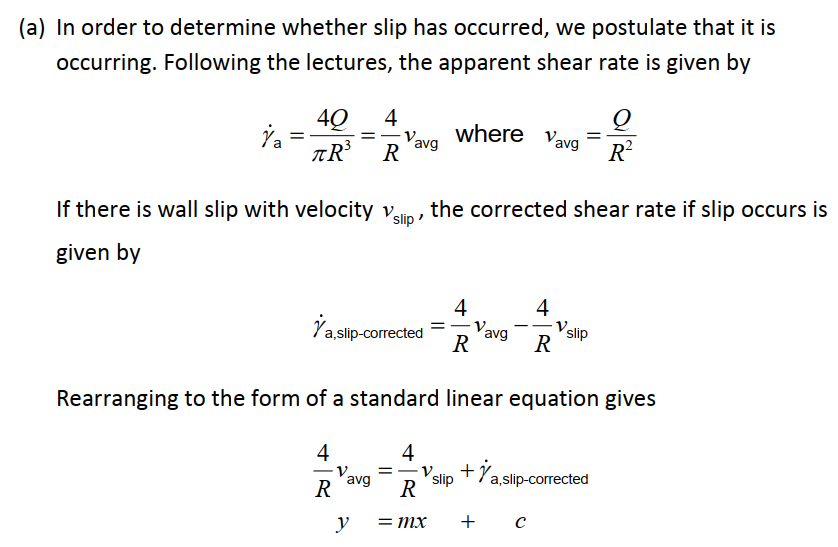
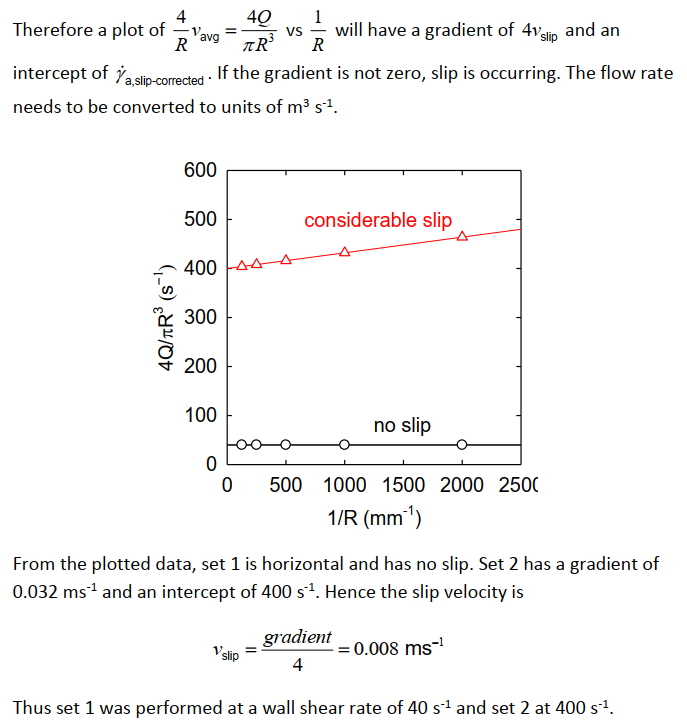
A capillary rheometer is being used to characterise a grade of honey. (a) Two sets of measurements have been made in order to establish approximately at which wall shear stress slip occurs. A circular die of varying length L and radius R was used; the pressure drop Pmeas across the capillary was set and the mass m extruded through the capillary in 10 minutes were measured. Use the data to determine whether there is wall slip in each set of measurements, and calculate the slip velocity. You may assume that the density of honey is 1.36 g mL-1. set 1 R (m) 0.0005 0.001 0.002 0.004 0.008 0.0005 0.001 0.002 0.004 0.008 L (m) 0.100 0.100 0.100 0.100 0.100 0.050 0.050 0.050 0.050 0.050 Pmeas (Pa) 163000 83000 43000 23000 13000 830000 430000 230000 130000 80000 m (kg / 10 mins) 0.0032 0.0256 0.205 1.64 13.1 0.0372 0.277 2.13 16.7 132 set 2 (a) In order to determine whether slip has occurred, we postulate that it is occurring. Following the lectures, the apparent shear rate is given by 4Q ja where Vavg = 4 R avg O R? aR If there is wall slip with velocity Vslip , the corrected shear rate if slip occurs is given by 4 4 Ya,- = slip-corrected Vavg V slip R R Rearranging to the form of a standard linear equation gives 4 4 = Vsip + a,slip-corrected avg a R R - = mx + c 1 = avg VS AR 4 49 1 Therefore a plot of will have a gradient of 4Vslip and an R R intercept of a,slip-corrected. If the gradient is not zero, slip is occurring. The flow rate needs to be converted to units of m3s1. 600 500 considerable slip 400 4Q/TR(5-) 300 200 100 no slip 0 0 500 1000 1500 2000 2500 1/R (mm) From the plotted data, set 1 is horizontal and has no slip. Set 2 has a gradient of 0.032 ms - and an intercept of 400 s1. Hence the slip velocity is slip gradient = 0.008 ms- 4 Thus set 1 was performed at a wall shear rate of 40 s1 and set 2 at 400 s1
Step by Step Solution
There are 3 Steps involved in it

Get step-by-step solutions from verified subject matter experts