

Question: How were c & d found? 24. Use the chart that follows to determine the: a. Break-even point (units and sales). 200 units for $4,000
How were c & d found?
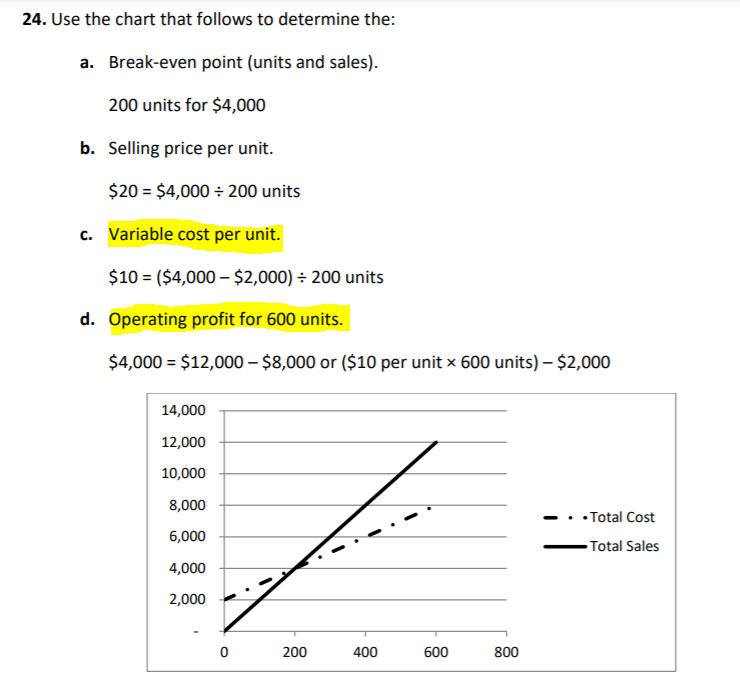
24. Use the chart that follows to determine the: a. Break-even point (units and sales). 200 units for $4,000 b. Selling price per unit. $20 = $4,000 + 200 units C. Variable cost per unit. $10 = ($4,000 $2,000) = 200 units d. Operating profit for 600 units. $4,000 = $12,000 - $8,000 or ($10 per unit x 600 units) $2,000 14,000 12,000 10,000 8,000 6,000 Total Cost - Total Sales 4,000 2,000 0 200 400 600 800
Step by Step Solution
There are 3 Steps involved in it
1 Expert Approved Answer
Step: 1 Unlock

Question Has Been Solved by an Expert!
Get step-by-step solutions from verified subject matter experts
Step: 2 Unlock
Step: 3 Unlock