

Question: How were the graphical solutions obtained using a hodograph? Can someone clarify step by step? Example 5.13 For the Gulfstream IV considered in the previous
How were the graphical solutions obtained using a hodograph? Can someone clarify step by step?
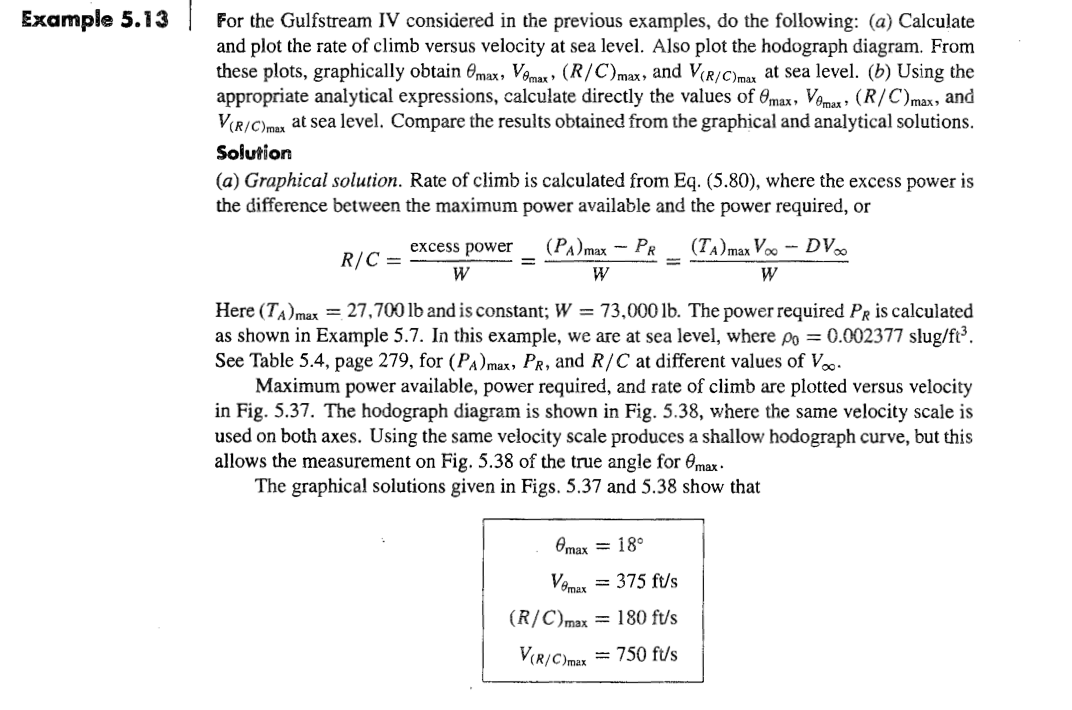
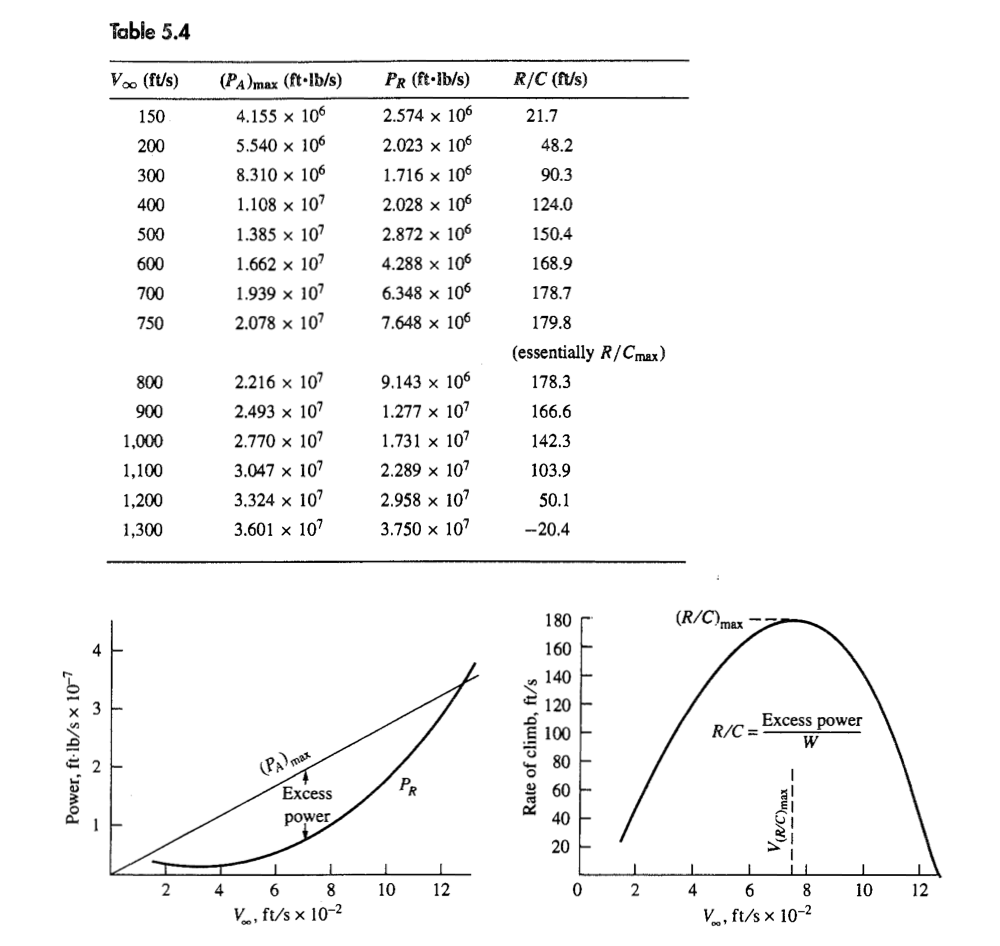
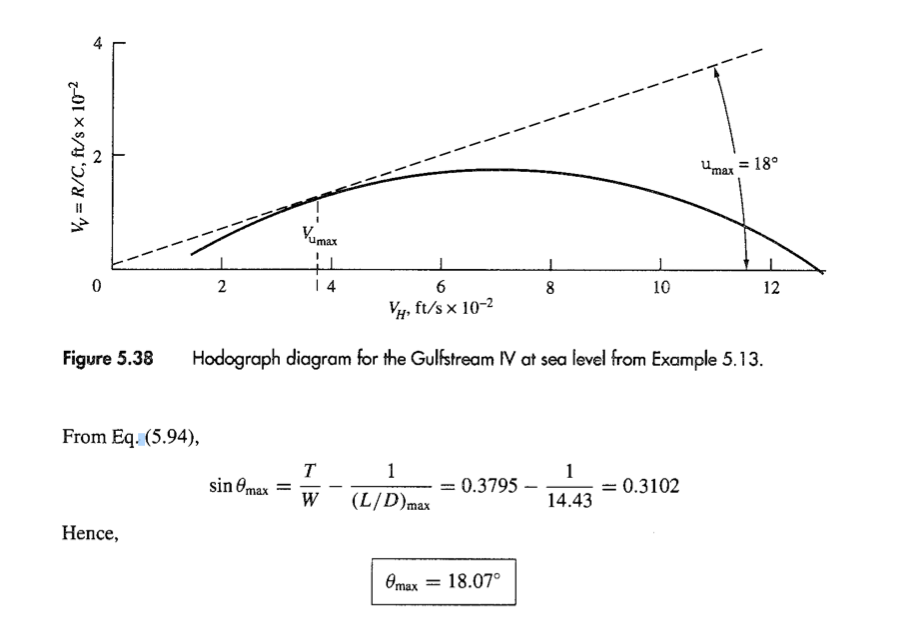
Example 5.13 For the Gulfstream IV considered in the previous examples, do the following: (a) Calculate and plot the rate of climb versus velocity at sea level. Also plot the hodograph diagram. From these plots, graphically obtain max, Vmax (R/C) max, and V(R/C) max at sea level. (b) Using the appropriate analytical expressions, calculate directly the values of 0 max, Vemax (R/C) max, and V(R/C) max at sea level. Compare the results obtained from the graphical and analytical solutions. Solution (a) Graphical solution. Rate of climb is calculated from Eq. (5.80), where the excess power is the difference between the maximum power available and the power required, or R/C = W excess power (PA) max - PR W (TA) max VooDV W Here (TA) max 27,700 lb and is constant; W = 73,000 lb. The power required PR is calculated as shown in Example 5.7. In this example, we are at sea level, where po = 0.002377 slug/ft. See Table 5.4, page 279, for (PA) max, PR, and R/C at different values of Vo.. Maximum power available, power required, and rate of climb are plotted versus velocity in Fig. 5.37. The hodograph diagram is shown in Fig. 5.38, where the same velocity scale is used on both axes. Using the same velocity scale produces a shallow hodograph curve, but this allows the measurement on Fig. 5.38 of the true angle for @max. The graphical solutions given in Figs. 5.37 and 5.38 show that Omax = 18 Vemax = 375 ft/s (R/C) max 180 ft/s V(R/C)max = 750 ft/s
Step by Step Solution
There are 3 Steps involved in it
it is suggested to apply a graphical method to produce kine... View full answer

Get step-by-step solutions from verified subject matter experts