

Question: How would a program with the following requirements look? The issue I'm specifically having is figuring out how to get the graph portion functioning. (Note:
How would a program with the following requirements look? The issue I'm specifically having is figuring out how to get the graph portion functioning. (Note: The portion for graphing/graph points use for loops, no external packages or anything like that).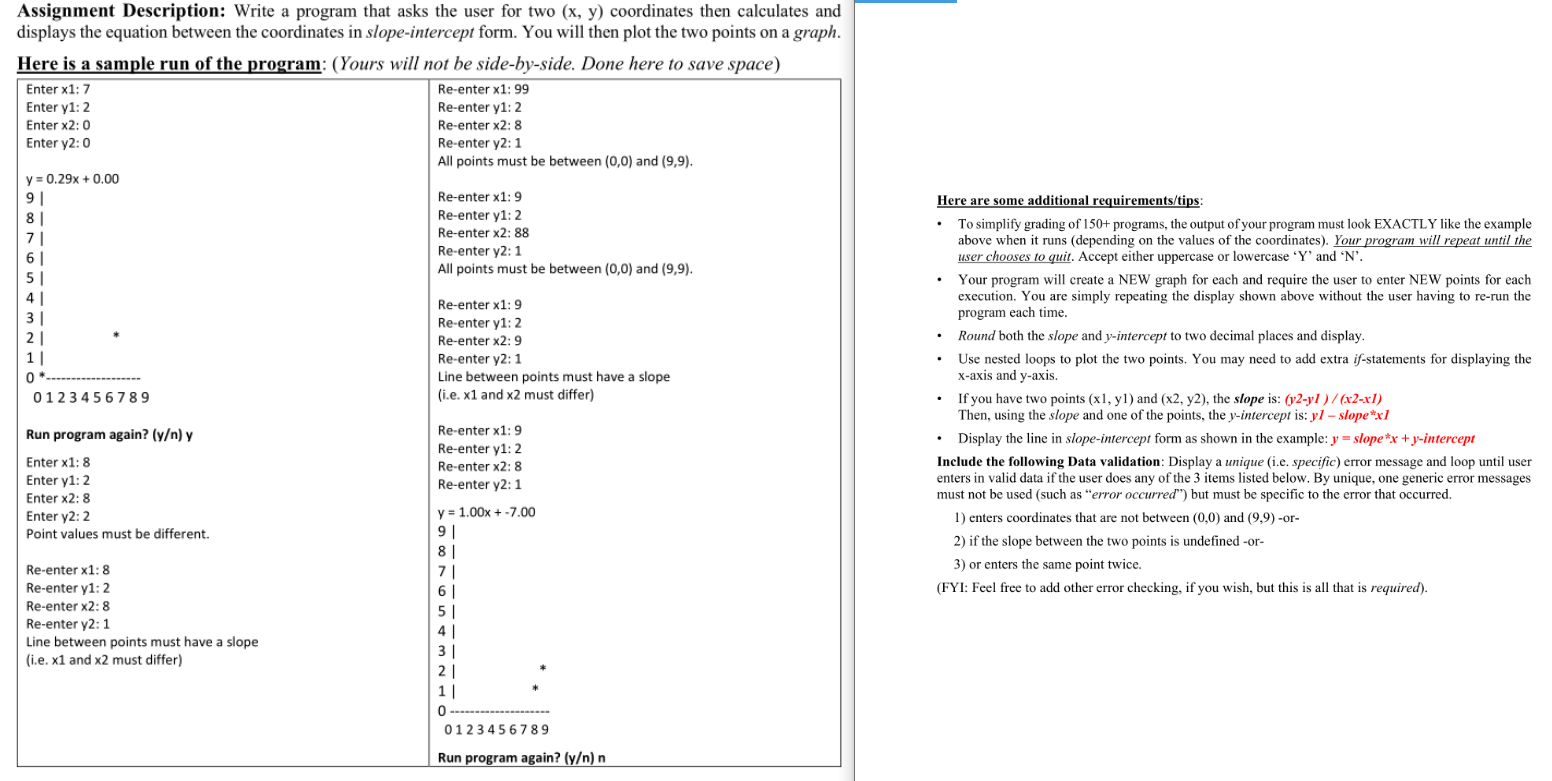
Assignment Description: Write a program that asks the user for two (x, y) coordinates then calculates and displays the equation between the coordinates in slope-intercept form. You will then plot the two points on a graph. Here is a sample run of the program: (Yours will not be side-by-side. Done here to save space) Enter x1:7 Re-enter x1: 99 Enter y1:2 Re-enter y1:2 Enter x2:0 Re-enter x2:8 Enter y2:0 Re-enter y2:1 All points must be between (0,0) and (9,9). y = 0.29x + 0.00 Re-enter x1: 9 Re-enter y1:2 Re-enter x2: 88 Re-enter y2:1 All points must be between (0,0) and (9,9). 91 Re-enter x1:9 Re-enter y1:2 Re-enter x2:9 Re-enter y2:1 Line between points must have a slope (i.e. x1 and x2 must differ) 0 . 0 1 2 3 4 5 6 7 8 9 Here are some additional requirements/tips To simplify grading of 150+ programs, the output of your program must look EXACTLY like the example above when it runs (depending on the values of the coordinates). Your program will repeat until the user chooses to quit. Accept either uppercase or lowercase 'Y' and 'N'. Your program will create a NEW graph for each and require the user to enter NEW points for each execution. You are simply repeating the display shown above without the user having to re-run the program each time. Round both the slope and y-intercept to two decimal places and display. Use nested loops to plot the two points. You may need to add extra if-statements for displaying the X-axis and y-axis. If you have two points (x1, yl) and (x2, y2), the slope is: (y2-yl)/(x2-x1) Then, using the slope and one of the points, the y-intercept is: yl - slope*xl Display the line in slope-intercept form as shown in the example: y = slope *x + y-intercept Include the following Data validation: Display a unique (i.e. specific) error message and loop until user enters in valid data if the user does any of the 3 items listed below. By unique, one generic error messages must not be used (such as "error occurred") but must be specific to the error that occurred. 1) enters coordinates that are not between (0,0) and (9,9) -or- 2) if the slope between the two points is undefined -or- 3) or enters the same point twice. (FYI: Feel free to add other error checking, if you wish, but this is all that is required). Run program again? (y) y Re-enter x1:9 Re-enter y1: 2 Re-enter x2:8 Re-enter y2:1 Enter x1:8 Enter y1:2 Enter x2:8 Enter y2: 2 Point values must be different. y = 1.00x + -7.00 9 8 Re-enter x1:8 Re-enter y1:2 Re-enter x2:8 Re-enter y2:1 Line between points must have a slope (i.e. x1 and x2 must differ) 1/ 0 1 2 3 4 5 6 7 8 9 Run program again? (y) n Assignment Description: Write a program that asks the user for two (x, y) coordinates then calculates and displays the equation between the coordinates in slope-intercept form. You will then plot the two points on a graph. Here is a sample run of the program: (Yours will not be side-by-side. Done here to save space) Enter x1:7 Re-enter x1: 99 Enter y1:2 Re-enter y1:2 Enter x2:0 Re-enter x2:8 Enter y2:0 Re-enter y2:1 All points must be between (0,0) and (9,9). y = 0.29x + 0.00 Re-enter x1: 9 Re-enter y1:2 Re-enter x2: 88 Re-enter y2:1 All points must be between (0,0) and (9,9). 91 Re-enter x1:9 Re-enter y1:2 Re-enter x2:9 Re-enter y2:1 Line between points must have a slope (i.e. x1 and x2 must differ) 0 . 0 1 2 3 4 5 6 7 8 9 Here are some additional requirements/tips To simplify grading of 150+ programs, the output of your program must look EXACTLY like the example above when it runs (depending on the values of the coordinates). Your program will repeat until the user chooses to quit. Accept either uppercase or lowercase 'Y' and 'N'. Your program will create a NEW graph for each and require the user to enter NEW points for each execution. You are simply repeating the display shown above without the user having to re-run the program each time. Round both the slope and y-intercept to two decimal places and display. Use nested loops to plot the two points. You may need to add extra if-statements for displaying the X-axis and y-axis. If you have two points (x1, yl) and (x2, y2), the slope is: (y2-yl)/(x2-x1) Then, using the slope and one of the points, the y-intercept is: yl - slope*xl Display the line in slope-intercept form as shown in the example: y = slope *x + y-intercept Include the following Data validation: Display a unique (i.e. specific) error message and loop until user enters in valid data if the user does any of the 3 items listed below. By unique, one generic error messages must not be used (such as "error occurred") but must be specific to the error that occurred. 1) enters coordinates that are not between (0,0) and (9,9) -or- 2) if the slope between the two points is undefined -or- 3) or enters the same point twice. (FYI: Feel free to add other error checking, if you wish, but this is all that is required). Run program again? (y) y Re-enter x1:9 Re-enter y1: 2 Re-enter x2:8 Re-enter y2:1 Enter x1:8 Enter y1:2 Enter x2:8 Enter y2: 2 Point values must be different. y = 1.00x + -7.00 9 8 Re-enter x1:8 Re-enter y1:2 Re-enter x2:8 Re-enter y2:1 Line between points must have a slope (i.e. x1 and x2 must differ) 1/ 0 1 2 3 4 5 6 7 8 9 Run program again? (y) n
Step by Step Solution
There are 3 Steps involved in it

Get step-by-step solutions from verified subject matter experts