

Question: How would I be able to chart this in excel? 199310 199311 199312 199401 199402 199403 199404 199405 199406 199407 199408 199409 199410 199411 199412
How would I be able to chart this in excel?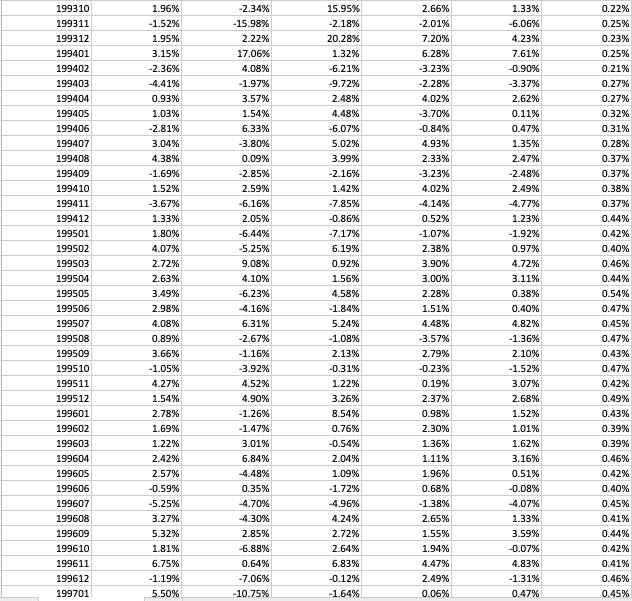
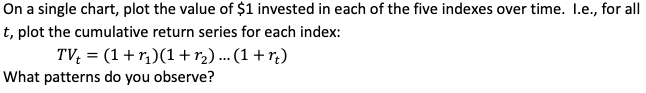
199310 199311 199312 199401 199402 199403 199404 199405 199406 199407 199408 199409 199410 199411 199412 199501 199502 199503 199504 199505 199506 199507 199508 199509 199510 199511 199512 199601 199602 199603 199604 199605 199606 199607 199608 199609 199610 199611 199612 199701 1.96% -1.52% 1.95% 3.15% -2.36% -4.41% 0.93% 1.03% -2.81% 3.04% 4.38% -1.69% 1.52% -3.67% 1.33% 1.80% 4.07% 2.72% 2.63% 3.49% 2.98% 4.08% 0.89% 3.66% -1.05% 4.27% 1.54% 2.78% 1.69% 1.22% 2.42% 2.57% -0.59% -5.25% 3.27% 5.32% 1.81% 6.75% -1.19% 5.50% -2.34% -15.98% 2.22% 17.06% 4.08% -1.97% 3.57% 1.54% 6.33% -3.80% 0.09% -2.85% 2.59% -6.16% 2.05% -6.44% -5.25% 9.08% 4.10% -6.23% -4.16% 6.31% -2.67% -1.16% -3.92% 4.52% 4.90% -1.26% -1.47% 3.01% 6.84% -4.48% 0.35% -4.70% -4.30% 2.85% -6.88% 0.64% -7.06% -10.75% 15.95% -2.18% 20.28% 1.32% -6.21% -9.72% 2.48% 4.48% -6.07% 5.02% 3.99% -2.16% 1.42% -7.85% -0.86% -7.17% 6.19% 0.92% 1.56% 4.58% -1.84% 5.24% -1.08% 2.13% -0.31% 1.22% 3.26% 8.54% 0.76% -0.54% 2.04% 1.09% -1.72% -4.96% 4.24% 2.72% 2.64% 6.83% -0.12% -1.64% 2.66% -2.01% 7.20% 6.28% -3.23% -2.28% 4.02% -3.70% -0.84% 4.93% 2.33% -3.23% 4.02% -4.14% 0.52% -1.07% 2.38% 3.90% 3.00% 2.28% 1.51% 4.48% -3.57% 2.79% -0.23% 0.19% 2.37% 0.98% 2.30% 1.36% 1.11% 1.96% 0.68% -1.38% 2.65% 1.55% 1.94% 4.47% 2.49% 0.06% 1.33% -6.06% 4.23% 7.61% -0.90% -3.37% 2.62% 0.11% 0.47% 1.35% 2.47% -2.48% 2.49% -4.77% 1.23% -1.92% 0.97% 4.72% 3.11% 0.38% 0.40% 4.82% -1.36% 2.10% -1.52% 3.07% 2.68% 1.52% 1.01% 1.62% 3.16% 0.51% -0.08% -4.07% 1.33% 3.59% -0.07% 4.83% -1.31% 0.47% 0.22% 0.25% 0.23% 0.25% 0.21% 0.27% 0.27% 0.32% 0.31% 0.28% 0.37% 0.37% 0.38% 0.37% 0.44% 0.42% 0.40% 0.46% 0.44% 0.54% 0.47% 0.45% 0.47% 0.43% 0.47% 0.42% 0.49% 0.43% 0.39% 0.39% 0.46% 0.42% 0.40% 0.45% 0.41% 0.44% 0.42% 0.41% 0.46% 0.45% On a single chart, plot the value of $1 invested in each of the five indexes over time. I.e., for all t, plot the cumulative return series for each index: TV = (1 + r)(1+r2)... (1+r) What patterns do you observe? 199310 199311 199312 199401 199402 199403 199404 199405 199406 199407 199408 199409 199410 199411 199412 199501 199502 199503 199504 199505 199506 199507 199508 199509 199510 199511 199512 199601 199602 199603 199604 199605 199606 199607 199608 199609 199610 199611 199612 199701 1.96% -1.52% 1.95% 3.15% -2.36% -4.41% 0.93% 1.03% -2.81% 3.04% 4.38% -1.69% 1.52% -3.67% 1.33% 1.80% 4.07% 2.72% 2.63% 3.49% 2.98% 4.08% 0.89% 3.66% -1.05% 4.27% 1.54% 2.78% 1.69% 1.22% 2.42% 2.57% -0.59% -5.25% 3.27% 5.32% 1.81% 6.75% -1.19% 5.50% -2.34% -15.98% 2.22% 17.06% 4.08% -1.97% 3.57% 1.54% 6.33% -3.80% 0.09% -2.85% 2.59% -6.16% 2.05% -6.44% -5.25% 9.08% 4.10% -6.23% -4.16% 6.31% -2.67% -1.16% -3.92% 4.52% 4.90% -1.26% -1.47% 3.01% 6.84% -4.48% 0.35% -4.70% -4.30% 2.85% -6.88% 0.64% -7.06% -10.75% 15.95% -2.18% 20.28% 1.32% -6.21% -9.72% 2.48% 4.48% -6.07% 5.02% 3.99% -2.16% 1.42% -7.85% -0.86% -7.17% 6.19% 0.92% 1.56% 4.58% -1.84% 5.24% -1.08% 2.13% -0.31% 1.22% 3.26% 8.54% 0.76% -0.54% 2.04% 1.09% -1.72% -4.96% 4.24% 2.72% 2.64% 6.83% -0.12% -1.64% 2.66% -2.01% 7.20% 6.28% -3.23% -2.28% 4.02% -3.70% -0.84% 4.93% 2.33% -3.23% 4.02% -4.14% 0.52% -1.07% 2.38% 3.90% 3.00% 2.28% 1.51% 4.48% -3.57% 2.79% -0.23% 0.19% 2.37% 0.98% 2.30% 1.36% 1.11% 1.96% 0.68% -1.38% 2.65% 1.55% 1.94% 4.47% 2.49% 0.06% 1.33% -6.06% 4.23% 7.61% -0.90% -3.37% 2.62% 0.11% 0.47% 1.35% 2.47% -2.48% 2.49% -4.77% 1.23% -1.92% 0.97% 4.72% 3.11% 0.38% 0.40% 4.82% -1.36% 2.10% -1.52% 3.07% 2.68% 1.52% 1.01% 1.62% 3.16% 0.51% -0.08% -4.07% 1.33% 3.59% -0.07% 4.83% -1.31% 0.47% 0.22% 0.25% 0.23% 0.25% 0.21% 0.27% 0.27% 0.32% 0.31% 0.28% 0.37% 0.37% 0.38% 0.37% 0.44% 0.42% 0.40% 0.46% 0.44% 0.54% 0.47% 0.45% 0.47% 0.43% 0.47% 0.42% 0.49% 0.43% 0.39% 0.39% 0.46% 0.42% 0.40% 0.45% 0.41% 0.44% 0.42% 0.41% 0.46% 0.45% On a single chart, plot the value of $1 invested in each of the five indexes over time. I.e., for all t, plot the cumulative return series for each index: TV = (1 + r)(1+r2)... (1+r) What patterns do you observe
Step by Step Solution
There are 3 Steps involved in it

Get step-by-step solutions from verified subject matter experts