

Question: How would I do steps A-E? Expected return, standard deviation, and the capital asset pricing model) Below you have been provided the prices for Citigroup
How would I do steps A-E?
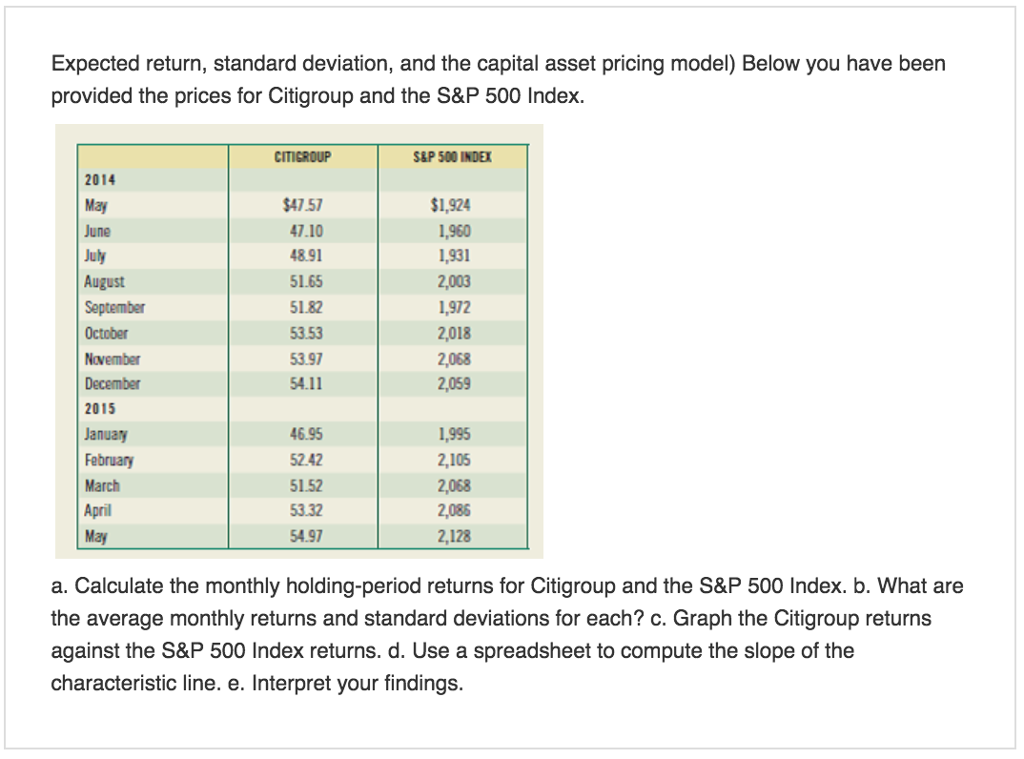
Expected return, standard deviation, and the capital asset pricing model) Below you have been provided the prices for Citigroup and the S&P 500 Index. CITIGROUF S&P 500 INDEX 2014 May June July August 47.57 47.10 48.91 51.65 1.82 53.53 53.97 54.11 $1,924 1,960 1,931 2,003 1,972 2,018 2,068 2,059 October December 2015 January February March April Maj 46.95 52.42 51.52 53.32 54.97 1,995 2,105 2,068 2,086 2,128 a. Calculate the monthly holding-period returns for Citigroup and the S&P 500 Index. b. What are the average monthly returns and standard deviations for each? c. Graph the Citigroup returns against the S&P 500 Index returns. d. Use a spreadsheet to compute the slope of the characteristic line. e. Interpret your findings
Step by Step Solution
There are 3 Steps involved in it

Get step-by-step solutions from verified subject matter experts