

Question: How would I import this data into R and make a double bar graph? X-axis is the days column, while the y-axis represents the number
How would I import this data into R and make a double bar graph? X-axis is the days column, while the y-axis represents the number of students who attended each type of school per day.
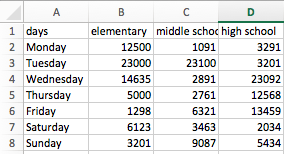
A 1 days 2 Monday 3 Tuesday 4 Wednesday 5 Thursday 6 Friday 7 Saturday 8 Sunday B D elementary middle schoc high school 12500 1091 3291 23000 23100 3201 14635 2891 23092 5000 2761 12568 1298 6321 13459 6123 3463 2034 3201 9087 5434 A 1 days 2 Monday 3 Tuesday 4 Wednesday 5 Thursday 6 Friday 7 Saturday 8 Sunday B D elementary middle schoc high school 12500 1091 3291 23000 23100 3201 14635 2891 23092 5000 2761 12568 1298 6321 13459 6123 3463 2034 3201 9087 5434
Step by Step Solution
There are 3 Steps involved in it
1 Expert Approved Answer
Step: 1 Unlock

Question Has Been Solved by an Expert!
Get step-by-step solutions from verified subject matter experts
Step: 2 Unlock
Step: 3 Unlock