

Question: how would i input these numbers into excel. what model will i use? pleae helpp bikes and other outdoor supplies. A little over 6 years
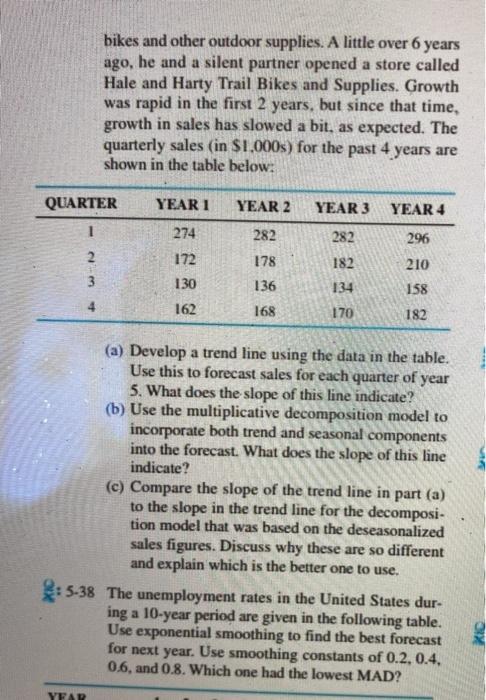
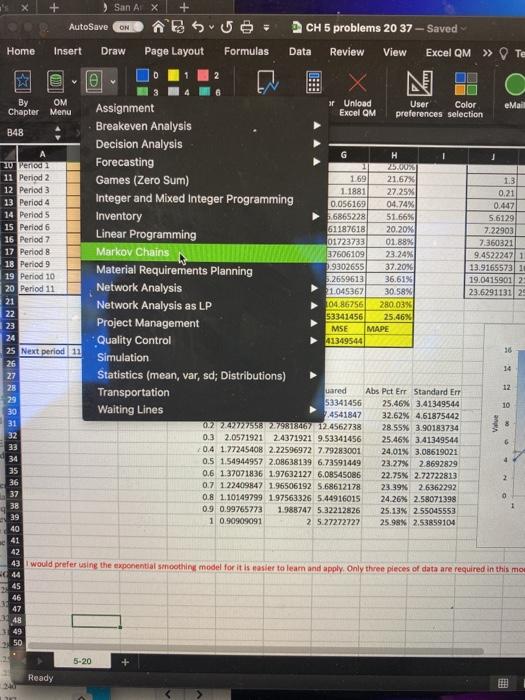
bikes and other outdoor supplies. A little over 6 years ago, he and a silent partner opened a store called Hale and Harty Trail Bikes and Supplies. Growth was rapid in the first 2 years, but since that time, growth in sales has slowed a bit, as expected. The quarterly sales (in $1.000s) for the past 4 years are shown in the table below: QUARTER YEAR1 YEAR 2 YEAR 3 YEAR 4 274 282 282 296 2 172 182 178 136 3 130 210 158 134 170 162 168 182 (a) Develop a trend line using the data in the table. Use this to forecast sales for each quarter of year 5. What does the slope of this line indicate? (b) Use the multiplicative decomposition model to incorporate both trend and seasonal components into the forecast. What does the slope of this line indicate? (c) Compare the slope of the trend line in part (a) to the slope in the trend line for the decomposi- tion model that was based on the deseasonalized sales figures. Discuss why these are so different and explain which is the better one to use. :5-38 The unemployment rates in the United States dur- ing a 10-year period are given in the following table. Use exponential smoothing to find the best forecast for next year. Use smoothing constants of 0.2.0.4. 0.6, and 0.8. Which one had the lowest MAD? kic YEAR 's X San Al X AutoSave ON CH 5 problems 20 37 - Saved Data Review View Excel QM >> Te Home Insert Draw Page Layout Formulas @ 6 . OM ar Unload User Color eMail Chapter Menu Assignment Excel QM preferences selection Breakeven Analysis B48 Decision Analysis G H 10 Period 1 Forecasting 2.00% 11 Period 2 Games (Zero Sum) 1.69 21.675 1.3 12 Period 3 1 1881 27.25% 0.21 13 Period 4 Integer and Mixed Integer Programming 0.056169 04.74% 0.447 14 Period 5 Inventory 5.6865228 51.66% 5.6129 15 Period 6 51187618 20,20% Linear Programming 7.22903 16 Period 7 01723733 01.88% 7.360321 17 Period 8 Markov Chains 37606109 23.24% 9.45222471 18 Period 9 Material Requirements Planning 0.9302655 37.20% 13.91655731 19 Period 10 5.2559613 36,61% 19.04159012 20 Period 11 Network Analysis 01.045367 30.58% 23.629113129 21 Network Analysis as LP 104 86256 280.03% 22 53341456 25.46% 23 Project Management MSE MAPE 24 *Quality Control 41349544 25 Next period 12 16 Simulation 26 27 Statistics (mean, var, sd; Distributions) 28 Transportation uared 12 Abs Pct Err Standard Er 29 53341456 25.46% 3.41349544 10 30 Waiting Lines 7.4541847 32.62% 4.61875442 31 022427275582.79818467 12.4562738 28.55% 3.90183734 32 0.3 2.0571921 2.4371921 9.53341456 25.46% 3.41349544 33 20.4 1.77245408 2.22596972 7.79283001 24.01% 3.08619021 34 0.5 1.54944957 2.08638139 6.73591449 23.27% 2.8692829 35 0.6 1.37071836 1.97632127 6.08545086 22.75% 2.72722813 2 36 0.7 1.22409847 1.96506192 5.68612178 23:39% 2.6362292 37 0.8 1.10149799 1.97563326 5.44916015 24.26% 2.58071398 38 0.9 0.99765773 1.988747 5.32212826 25.13% 2 55045553 39 1 0.90909091 2 5.27272727 25.98% 2.53859104 40 41 42 43 I would prefer using the exponential smoothing model for it is easier to learn and apply. Only three pleces of data are required in this moe 44 45 46 47 48 49 50 Value F! 5-20 Ready
Step by Step Solution
There are 3 Steps involved in it

Get step-by-step solutions from verified subject matter experts