

Question: How would I interpret then explain this ANOVA analysis in nontechnical Total 109 81404.82 51935.378 4974.507 71544.49 91265.16 2681 178712 Tests of Homogeneity of Variances
How would I interpret then explain this ANOVA analysis in nontechnical
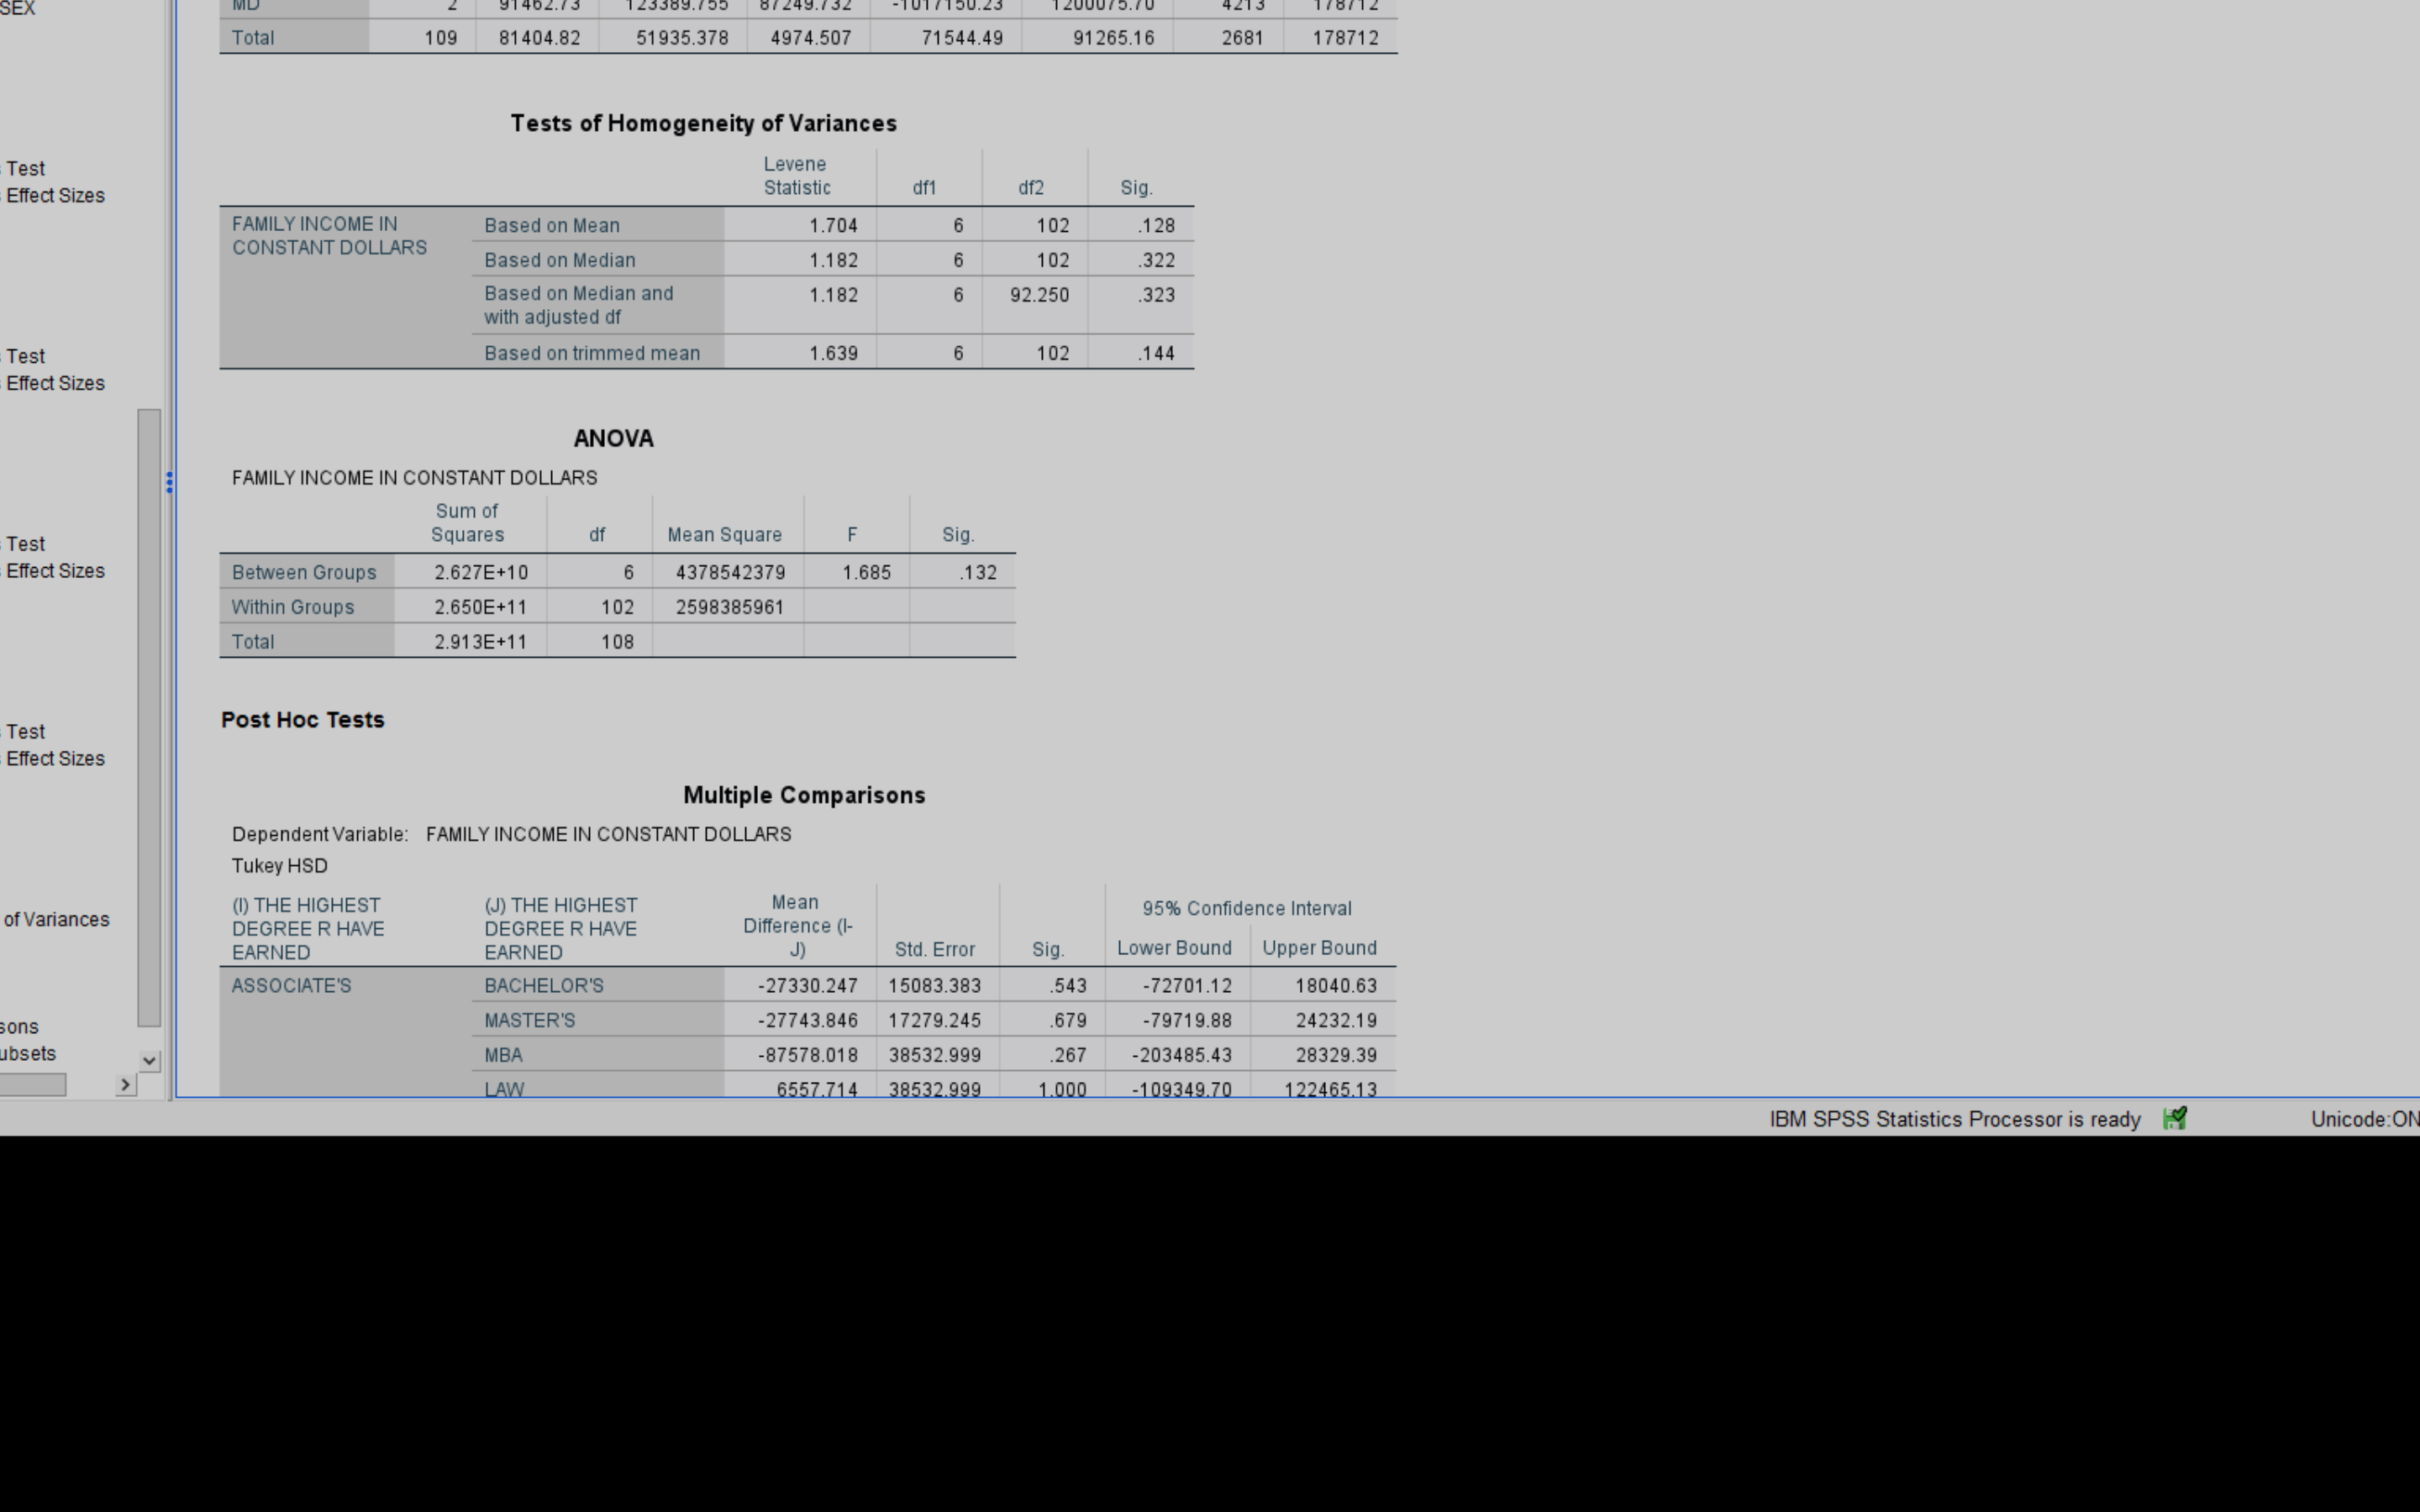
Total 109 81404.82 51935.378 4974.507 71544.49 91265.16 2681 178712 Tests of Homogeneity of Variances Test Leven Effect Sizes Statistic df2 Sig FAMILY INCOME IN Based on Mean 1.704 6 102 .128 CONSTANT DOLLARS Based on Median 1.18 6 102 322 Based on Median and 1.182 92.250 323 with adjusted df Test Based on trimmed mean 1.639 6 102 .144 Effect Sizes ANOVA FAMILY INCOME IN CONSTANT DOLLARS Sum of Test Squares df Mean Square F Sig. Effect Sizes Between Groups 2.627E+10 6 4378542379 1.685 132 Within Groups 2.650E+11 102 2598385961 Total 2.913E + 11 108 Test Post Hoc Tests Effect Sizes Multiple Comparisons Dependent Variable: FAMILY INCOME IN CONSTANT DOLLARS Tukey HSD (1) THE HIGHEST (J) THE HIGHEST Mean of Variances 95% Confidence Interval DEGREE R HAVE DEGREE R HAVE Difference (I- EARNED EARNED Std. Error Sig. Lower Bound Upper Bound ASSOCIATE'S BACHELOR'S 27330.247 15083.383 .543 -72701.12 18040.63 sons MASTER'S -27743.846 17279.245 679 -79719.88 24232.19 ubsets MBA -87578.018 38532.999 267 -203485.43 28329.39 LAW 6557.714 38532.999 1.000 109349.70 122465.13 IBM SPSS Statistics Processor is ready Unicode:ON
Step by Step Solution
There are 3 Steps involved in it

Get step-by-step solutions from verified subject matter experts