

Question: How would I solve this using Rstudio? The data from Hops.CSV is set below 2. Hops facilitate fermentation and add a desirable bitter flavour to
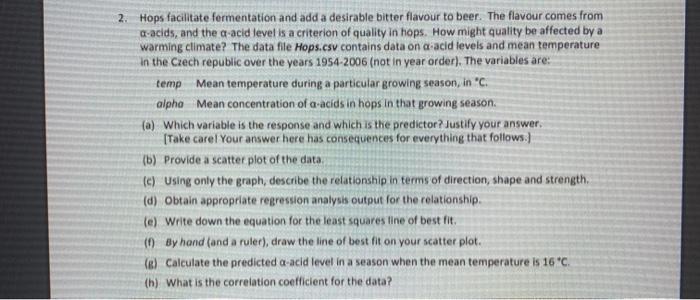
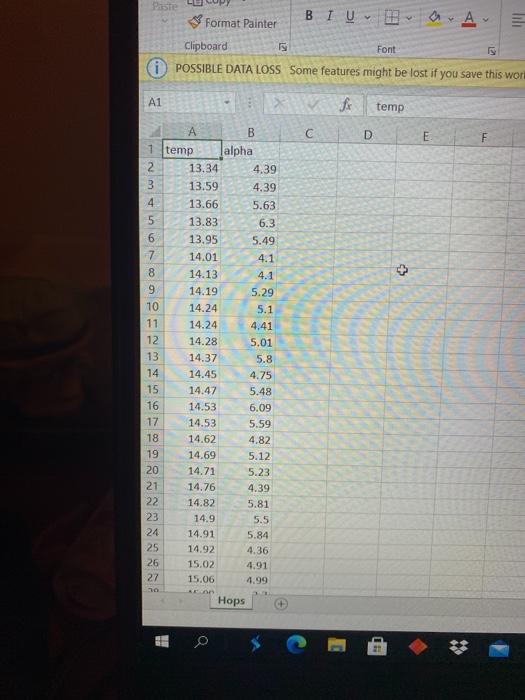
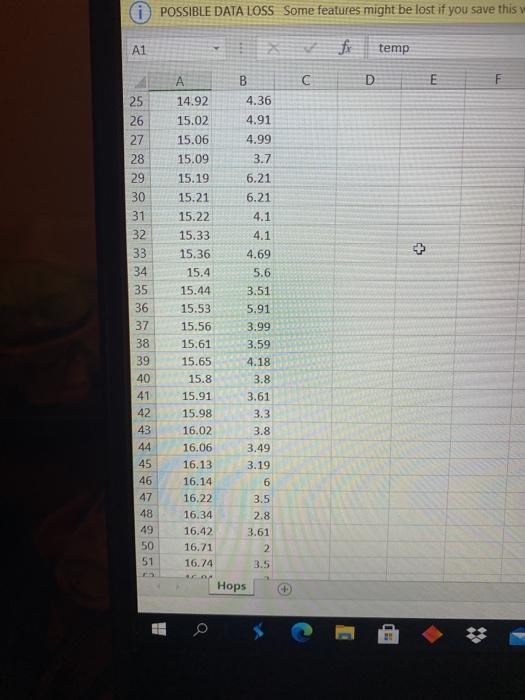
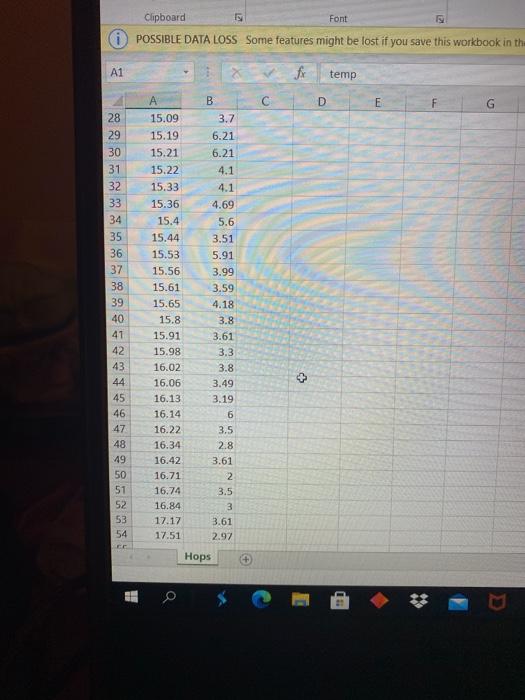
2. Hops facilitate fermentation and add a desirable bitter flavour to beer. The flavour comes from a-acids, and the a-acid level is a criterion of quality in hops. How might quality be affected by a warming climate? The data file Hops.csv contains data on a acid levels and mean temperature in the Czech republic over the years 1954-2006 (not in year order). The variables are: temp Mean temperature during a particular growing season, in "C: alpha Mean concentration of a-acids in hops In that growing season. (a) Which variable is the response and which is the predictor? Justify your answer [Take carel Your answer here has consequences for everything that follows: (6) Provide a scatter plot of the data (cy Using only the graph, describe the relationship in terms of direction, shape and strength. (d) Obtain appropriate regression analysis output for the relationship (e) Write down the equation for the least squares tine of best fit (O By hand and a ruler), draw the line of best fit on your scatter plot. (e) Calculate the predicted a-acid level in a season when the mean temperature is 16 *C. (h) What is the correlation coefficient for the data? lili Paste & Format Painter BIU Clipboard i POSSIBLE DATA LOSS Some features might be lost if you save this work Font A1 fr temp C D E A B 1 temp (alpha 2 13.34 4.39 3 13.59 4.39 4 13.66 5.63 5 13.83 6.3 6 13.95 5.49 7 14.01 4.1 8 14.13 4.1 9 14.19 5.29 10 14.24 5.1 11 14.24 4.41 12 14.28 5.01 13 14.37 5.8 14 14.45 4.75 15 14.47 5.48 16 14.53 6.09 17 14.53 5.59 18 14.62 4.82 19 14.69 5.12 20 14.71 5.23 21 14.76 4.39 22 14.82 5.81 23 14.9 5.5 24 14.91 5.84 25 14.92 4.36 26 15.02 4.91 27 15.06 4.99 Hops H iPOSSIBLE DATA LOSS Some features might be lost if you save this A1 temp A B C D E 4.36 4.91 14.92 15.02 15.06 15.09 4.99 3.7 15.19 15.21 15.22 15.33 15.36 15.4 25 26 27 28 29 30 31 32 33 34 35 36 37 38 39 40 41 42 43 44 45 15.44 15.53 15.56 15.61 15.65 15.8 15.91 15.98 16.02 16.06 16.13 16.14 16.22 16.34 16.42 16.71 16.74 6.21 6.21 4.1 4.1 4.69 5.6 3.51 5.91 3.99 3.59 4.18 3.8 3.61 3.3 3.8 3.49 3.19 6 3.5 2.8 3.61 2 3.5 46 47 48 49 50 51 Hops + Clipboard Font POSSIBLE DATA LOSS Some features might be lost if you save this workbook in the A1 temp C D E 28 29 30 31 32 33 34 35 36 37 38 39 40 41 42 15.09 15.19 15.21 15.22 15.33 15.36 15.4 15.44 15.53 15.56 15.61 15.65 15.8 15.91 15.98 16.02 16.06 16.13 16.14 16.22 16.34 16.42 16.71 16.74 16.84 17.17 17.51 B 3.7 6.21 6.21 4.1 4.1 4.69 5.6 3.51 5.91 3.99 3.59 4.18 3.8 3.61 3.3 3.8 3.49 3.19 6 3.5 2.8 3.61 2 3.5 3 3.61 2.97 43 5 44 45 46 47 48 49 50 51 52 53 54 EE Hops 2. Hops facilitate fermentation and add a desirable bitter flavour to beer. The flavour comes from a-acids, and the a-acid level is a criterion of quality in hops. How might quality be affected by a warming climate? The data file Hops.csv contains data on a acid levels and mean temperature in the Czech republic over the years 1954-2006 (not in year order). The variables are: temp Mean temperature during a particular growing season, in "C: alpha Mean concentration of a-acids in hops In that growing season. (a) Which variable is the response and which is the predictor? Justify your answer [Take carel Your answer here has consequences for everything that follows: (6) Provide a scatter plot of the data (cy Using only the graph, describe the relationship in terms of direction, shape and strength. (d) Obtain appropriate regression analysis output for the relationship (e) Write down the equation for the least squares tine of best fit (O By hand and a ruler), draw the line of best fit on your scatter plot. (e) Calculate the predicted a-acid level in a season when the mean temperature is 16 *C. (h) What is the correlation coefficient for the data? lili Paste & Format Painter BIU Clipboard i POSSIBLE DATA LOSS Some features might be lost if you save this work Font A1 fr temp C D E A B 1 temp (alpha 2 13.34 4.39 3 13.59 4.39 4 13.66 5.63 5 13.83 6.3 6 13.95 5.49 7 14.01 4.1 8 14.13 4.1 9 14.19 5.29 10 14.24 5.1 11 14.24 4.41 12 14.28 5.01 13 14.37 5.8 14 14.45 4.75 15 14.47 5.48 16 14.53 6.09 17 14.53 5.59 18 14.62 4.82 19 14.69 5.12 20 14.71 5.23 21 14.76 4.39 22 14.82 5.81 23 14.9 5.5 24 14.91 5.84 25 14.92 4.36 26 15.02 4.91 27 15.06 4.99 Hops H iPOSSIBLE DATA LOSS Some features might be lost if you save this A1 temp A B C D E 4.36 4.91 14.92 15.02 15.06 15.09 4.99 3.7 15.19 15.21 15.22 15.33 15.36 15.4 25 26 27 28 29 30 31 32 33 34 35 36 37 38 39 40 41 42 43 44 45 15.44 15.53 15.56 15.61 15.65 15.8 15.91 15.98 16.02 16.06 16.13 16.14 16.22 16.34 16.42 16.71 16.74 6.21 6.21 4.1 4.1 4.69 5.6 3.51 5.91 3.99 3.59 4.18 3.8 3.61 3.3 3.8 3.49 3.19 6 3.5 2.8 3.61 2 3.5 46 47 48 49 50 51 Hops + Clipboard Font POSSIBLE DATA LOSS Some features might be lost if you save this workbook in the A1 temp C D E 28 29 30 31 32 33 34 35 36 37 38 39 40 41 42 15.09 15.19 15.21 15.22 15.33 15.36 15.4 15.44 15.53 15.56 15.61 15.65 15.8 15.91 15.98 16.02 16.06 16.13 16.14 16.22 16.34 16.42 16.71 16.74 16.84 17.17 17.51 B 3.7 6.21 6.21 4.1 4.1 4.69 5.6 3.51 5.91 3.99 3.59 4.18 3.8 3.61 3.3 3.8 3.49 3.19 6 3.5 2.8 3.61 2 3.5 3 3.61 2.97 43 5 44 45 46 47 48 49 50 51 52 53 54 EE Hops
Step by Step Solution
There are 3 Steps involved in it

Get step-by-step solutions from verified subject matter experts