

Question: How would I write the Ho and Ha hypothesis and solve it :(? 2. An agronomist is interested in determining the yield response of cotton
How would I write the Ho and Ha hypothesis and solve it :(?
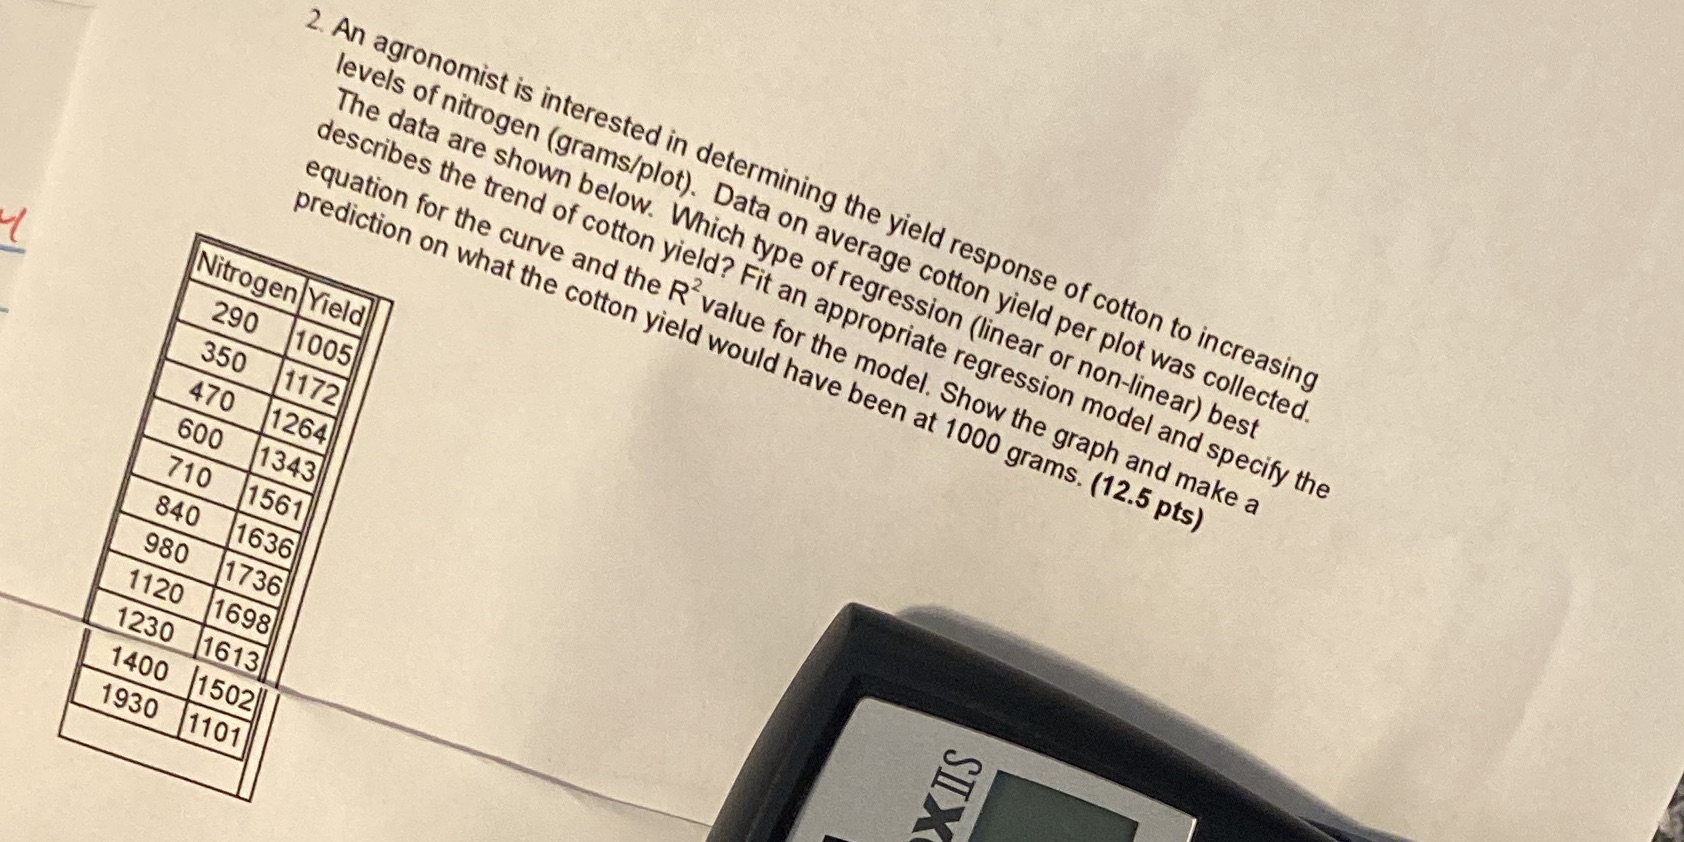
2. An agronomist is interested in determining the yield response of cotton to increasing levels of nitrogen (grams/plot). Data on average cotton yield per plot was collected. The data are shown below. Which type of regression (linear or non-linear) best describes the trend of cotton yield? Fit an appropriate regression model and specify the equation for the curve and the R value for the model. Show the graph and make a prediction on what the cotton yield would have been at 1000 grams. (12.5 pts) Nitrogen Yield 290 1005 350 1172 470 1264 600 1343 710 1561 840 1636 980 1736 XIS 1120 1698 1230 1613 1400 1502 1930 1101
Step by Step Solution
There are 3 Steps involved in it

Get step-by-step solutions from verified subject matter experts