

Question: How would this histogram be interpreted? 80 70 60 50 Frequency 40 30 20 10 -50 0 50 100 150 200 Bin
How would this histogram be interpreted?
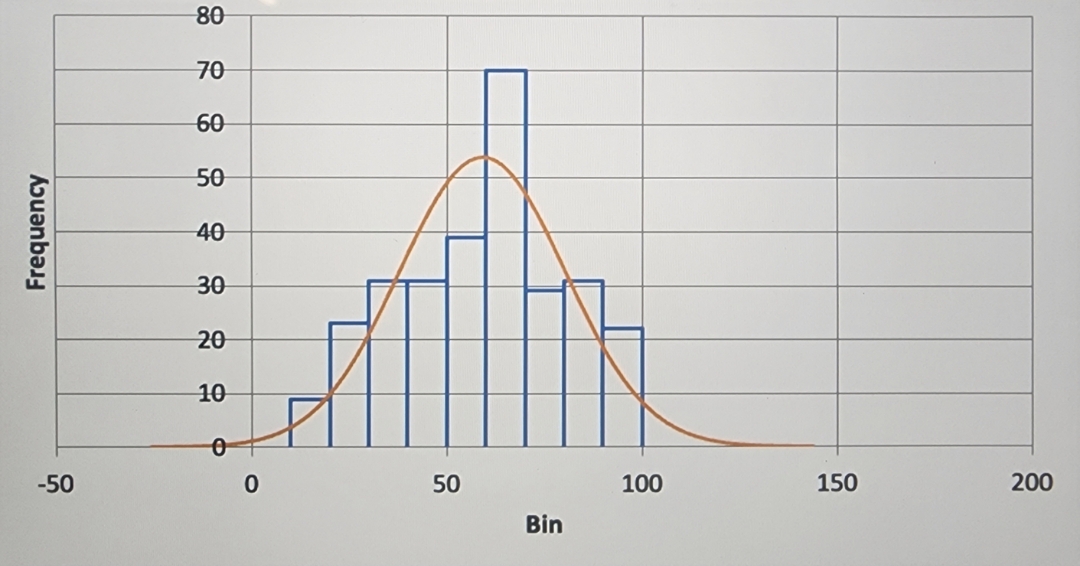
80 70 60 50 Frequency 40 30 20 10 -50 0 50 100 150 200 Bin
Step by Step Solution
There are 3 Steps involved in it
1 Expert Approved Answer
Step: 1 Unlock

Question Has Been Solved by an Expert!
Get step-by-step solutions from verified subject matter experts
Step: 2 Unlock
Step: 3 Unlock