

Question: How would this look like? Question 6 0.75 pts Frequency table results for Age: Count = 164 Age s Frequency Relative Frequency Percent of Total
How would this look like?
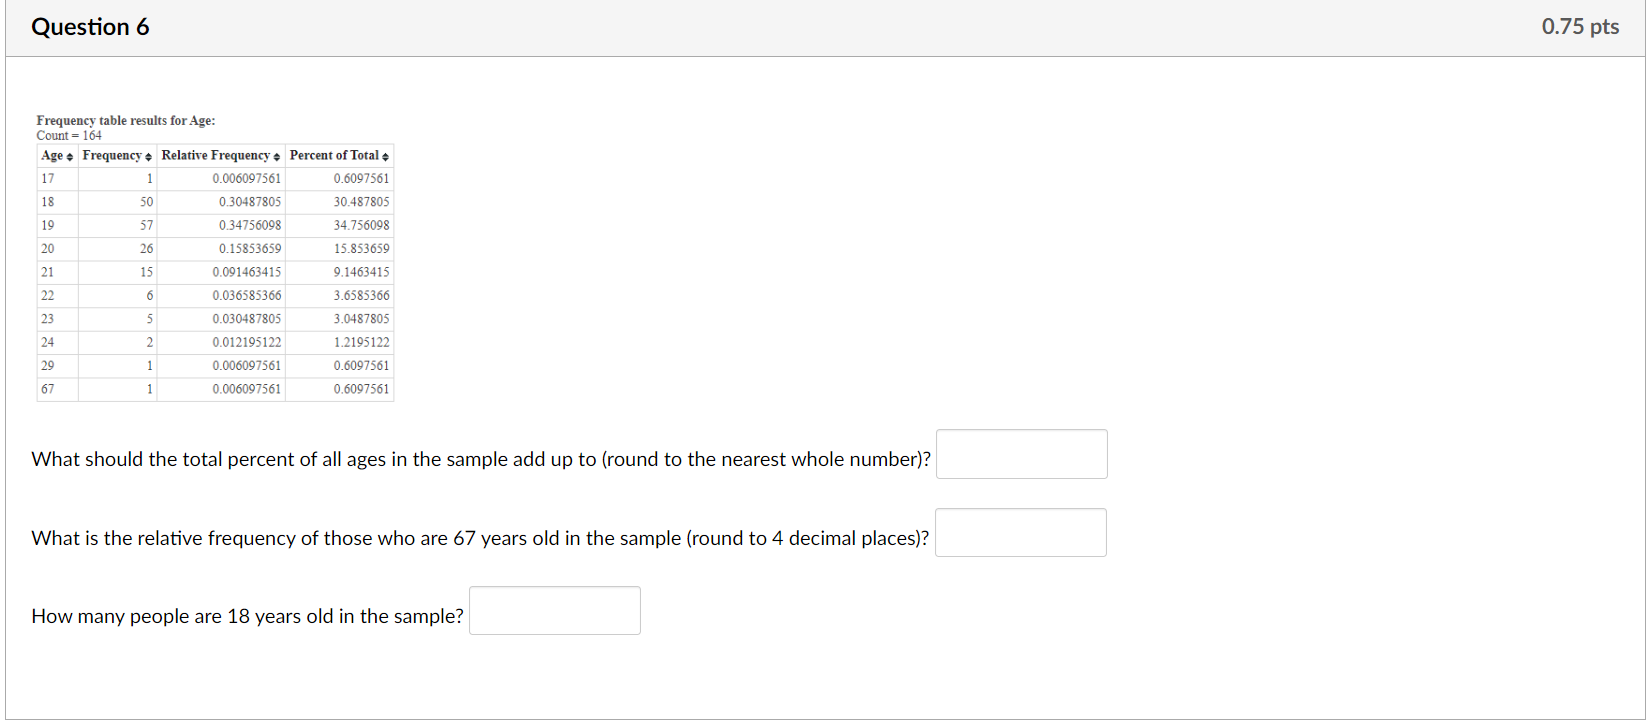
Question 6 0.75 pts Frequency table results for Age: Count = 164 Age s Frequency Relative Frequency Percent of Total 17 1 0.006097561 0.6007561 18 50 030487805 30.487805 19 57 034756008 34756008 20 26 0.15853659 15.833659 2 15 0.091463415 9.1463415 2 6 0.036583366 3.6585366 23 5 0.030487803 3.0487805 24 2 0.012195122 12195122 b 1 0.006097561 0.6007361 67 1 0.006097561 0.6097561 What should the total percent of all ages in the sample add up to (round to the nearest whole number)? What is the relative frequency of those who are 67 years old in the sample (round to 4 decimal places)? How many people are 18 years old in the sample
Step by Step Solution
There are 3 Steps involved in it

Get step-by-step solutions from verified subject matter experts