

Question: How would you create a PERT chart? Assume activities A-B-D-F-G are the project's critical path. Activity A B D E F G [Uwu U Optimistic-a
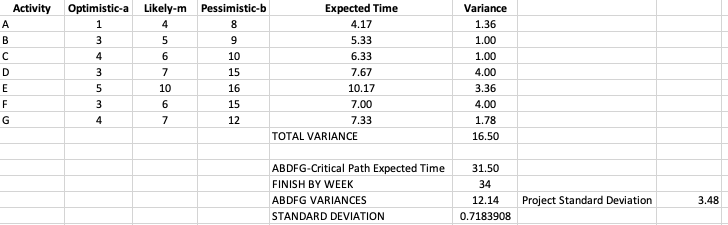
How would you create a PERT chart? Assume activities A-B-D-F-G are the project's critical path.
Step by Step Solution
There are 3 Steps involved in it
1 Expert Approved Answer
Step: 1 Unlock

Question Has Been Solved by an Expert!
Get step-by-step solutions from verified subject matter experts
Step: 2 Unlock
Step: 3 Unlock