

Question: How would you do this in R? I created a sample using rep_len() for each specified color and number of marbles then combined them into
 How would you do this in R? I created a sample using rep_len() for each specified color and number of marbles then combined them into one vector and created a sample set using sample() but I can't figure out how to plot them as asked
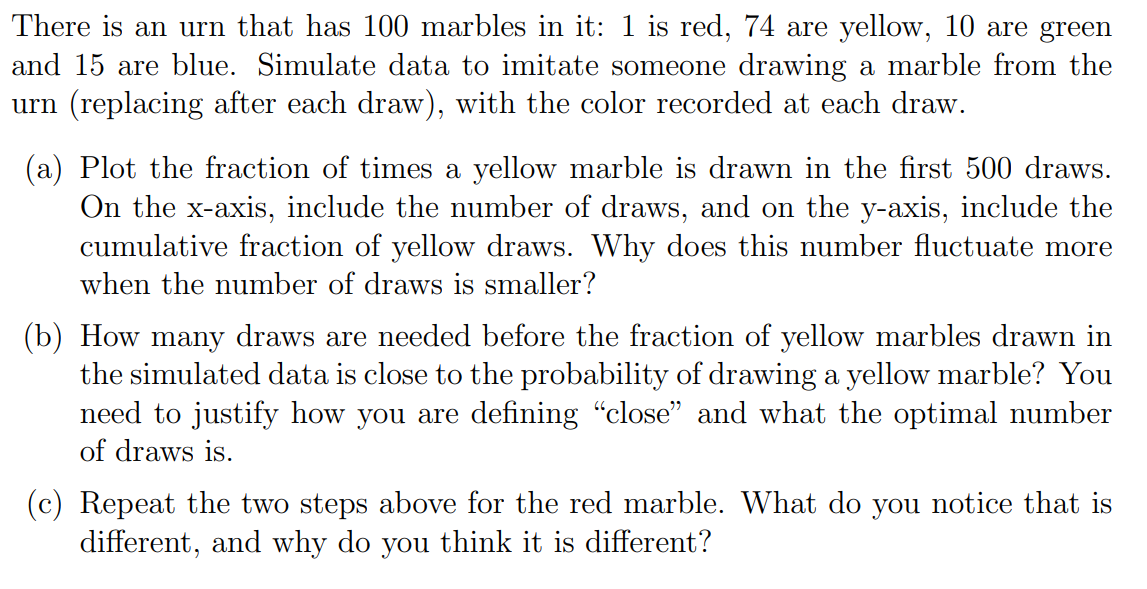
There is an urn that has 100 marbles in it: 1 is red, 74 are yellow, 10 are green and 15 are blue. Simulate data to imitate someone drawing a marble from the urn (replacing after each draw), with the color recorded at each draw. (a) Plot the fraction of times a yellow marble is drawn in the first 500 draws. On the x-axis, include the number of draws, and on the y-axis, include the cumulative fraction of yellow draws. Why does this number fluctuate more when the number of draws is smaller? (b) How many draws are needed before the fraction of yellow marbles drawn in the simulated data is close to the probability of drawing a yellow marble? You need to justify how you are defining close and what the optimal number of draws is. (c) Repeat the two steps above for the red marble. What do you notice that is different, and why do you think it is different? There is an urn that has 100 marbles in it: 1 is red, 74 are yellow, 10 are green and 15 are blue. Simulate data to imitate someone drawing a marble from the urn (replacing after each draw), with the color recorded at each draw. (a) Plot the fraction of times a yellow marble is drawn in the first 500 draws. On the x-axis, include the number of draws, and on the y-axis, include the cumulative fraction of yellow draws. Why does this number fluctuate more when the number of draws is smaller? (b) How many draws are needed before the fraction of yellow marbles drawn in the simulated data is close to the probability of drawing a yellow marble? You need to justify how you are defining close and what the optimal number of draws is. (c) Repeat the two steps above for the red marble. What do you notice that is different, and why do you think it is different
Step by Step Solution
There are 3 Steps involved in it

Get step-by-step solutions from verified subject matter experts