

Question: How would you explain your conclusion based on Panel C of Figure 1 to someone who works in the area of HIV research, but does
How would you explain your conclusion based on Panel C of Figure 1 to someone who works in the area of HIV research, but does not have an understanding of statistical terminology?Is having the p24 antigen advantageous or not?
?
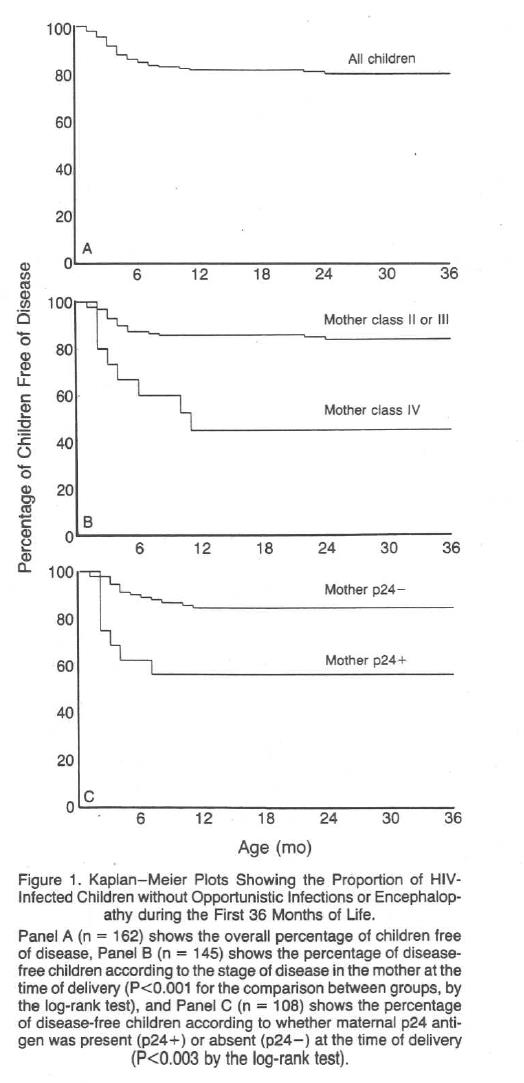
100TH All children BO 60 40 20 A 6 12 24 30 36 8 1 1001 Mother class 11 or ! !1 80 50 Mother class IV Percentage of Children Free of Disease* 40 20 B 12 18 24 30 36 100 Mother p24 - 80 Mother 12 4 + AD 20 oLC 12 18 24 30 36 Age ( mo ) Figure 1 . Kaplan - Meier Plots Showing the Proportion of HIV - Infected Children without Opportunistic Infections or Encephalop - athy during the First 36 Months of Life . Panel A ( 7 = 162 ) shows the overall percentage of children free* of disease , Panel B ( 7 = 145 ) shows the percentage of disease - free children according to the stage of disease in the mother at the time of delivery ( P
Step by Step Solution
There are 3 Steps involved in it

Get step-by-step solutions from verified subject matter experts