

Question: How would you interpret this Pareto Chart on the source of documentation errors causing defects? Pareto chart of description
How would you interpret this Pareto Chart on the source of documentation errors causing defects?
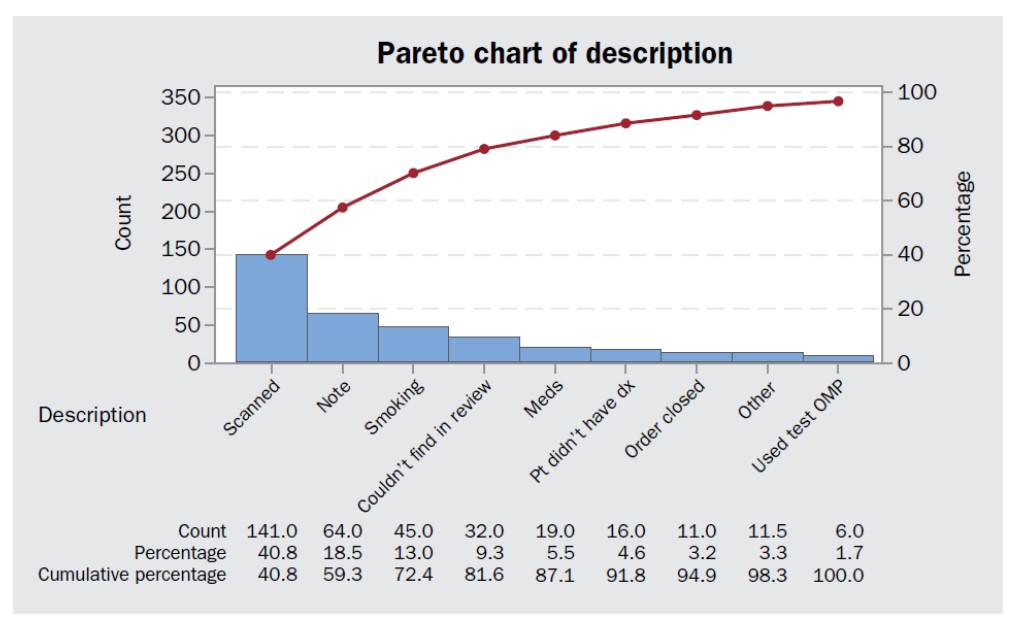
Pareto chart of description
Step by Step Solution
There are 3 Steps involved in it
1 Expert Approved Answer
Step: 1 Unlock

Question Has Been Solved by an Expert!
Get step-by-step solutions from verified subject matter experts
Step: 2 Unlock
Step: 3 Unlock