

Question: How would you solve this in Excel specifically using the RAND() function and a data table 1. A local bakery has to decide how many
How would you solve this in Excel specifically using the RAND() function and a data table
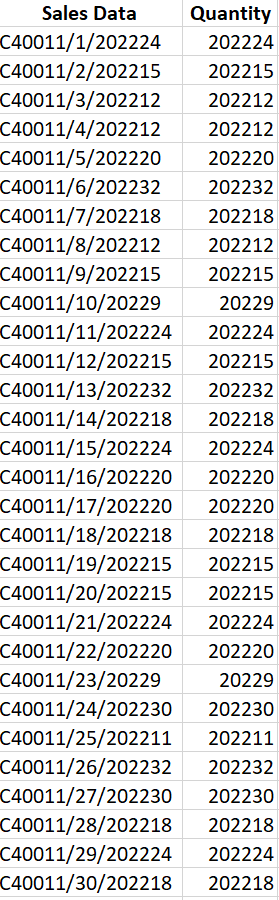
1. A local bakery has to decide how many doughnuts to make each day. Each doughnut costs $.35 to produce and sells for $.75. Any leftovers are sold as "day old" doughnuts for $.25 each. Given these conditions, how many doughnuts should the bakery produce? To help make the decision, the bakery has supplied you with the doughnut sales data for the month of November. The data is in the following format: ItemDateQuantity. Use this data to simulate 1000 days of sales and determine the number of doughnuts that produces the highest total profit. \begin{tabular}{|c|r|} \hline Sales Data & Quantity \\ \hline C40011/1/202224 & 202224 \\ \hline C40011/2/202215 & 202215 \\ \hline C40011/3/202212 & 202212 \\ \hline C40011/4/202212 & 202212 \\ \hline C40011/5/202220 & 202220 \\ \hline C40011/6/202232 & 202232 \\ \hline C40011/7/202218 & 202218 \\ \hline C40011/8/202212 & 202212 \\ \hline C40011/9/202215 & 202215 \\ \hline C40011/10/20229 & 20229 \\ \hline C40011/11/202224 & 202224 \\ \hline C40011/12/202215 & 202215 \\ \hline C40011/13/202232 & 202232 \\ \hline C40011/14/202218 & 202218 \\ \hline C40011/16/202224 & 202224 \\ \hline C40011/17/202220 & 202220 \\ \hline C40011/18/202218 & 202220 \\ \hline C40011/19/202215 & 202218 \\ \hline C40011/20/202215 & 202215 \\ \hline C40011/21/202224 & 202224 \\ \hline C40011/22/202220 & 202220 \\ \hline C40011/23/20229 & 20229 \\ \hline C40011/24/202230 & 202230 \\ \hline C40011/25/202211 & 202211 \\ \hline C40011/26/202232 & 202232 \\ \hline C40011/28/200202218 & 2022218 \\ \hline C40011/29/202224 & 202224 \\ \hline C40011/30/202218 & 202218 \\ \hline \end{tabular}
Step by Step Solution
There are 3 Steps involved in it

Get step-by-step solutions from verified subject matter experts