

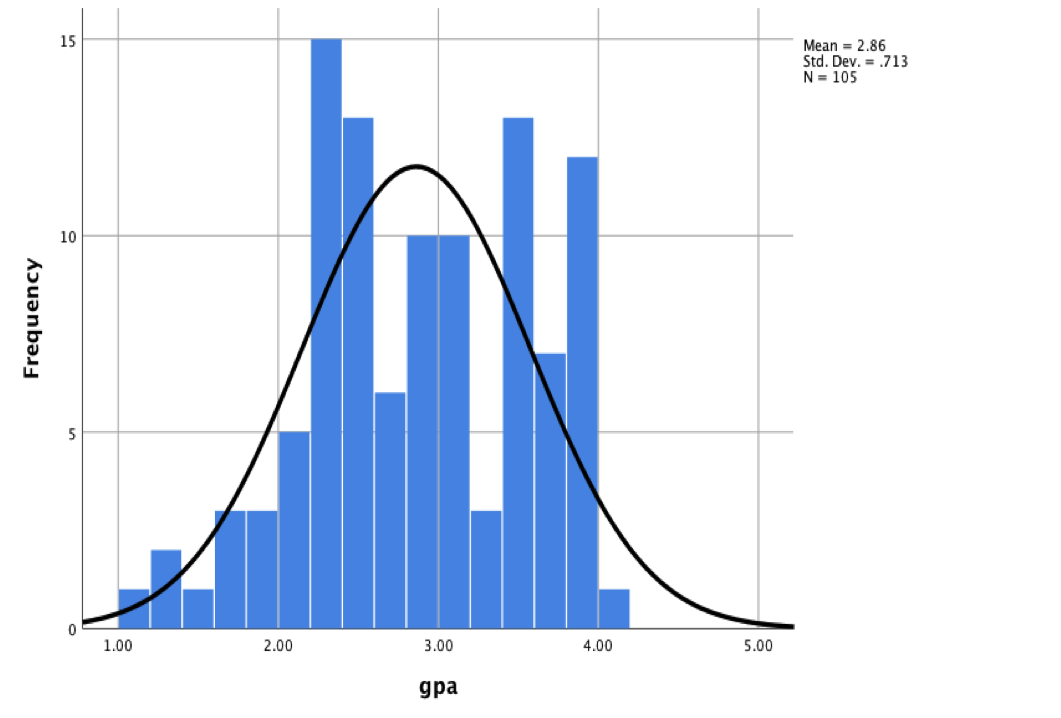
Question: How would you visually interpret the below histogram with regards to normal distribution, skewness, symmetry, outliers, etc? f
How would you visually interpret the below histogram with regards to normal distribution, skewness, symmetry, outliers, etc?
\f
Step by Step Solution
There are 3 Steps involved in it
1 Expert Approved Answer
Step: 1 Unlock

Question Has Been Solved by an Expert!
Get step-by-step solutions from verified subject matter experts
Step: 2 Unlock
Step: 3 Unlock