

Question: However, this data has a seasonal variation - it goes up and down depending on the time of year, on top of the long -
However, this data has a seasonal variation it goes up and down depending on the time of year, on top of the longterm trend. Plus of course there's variation from day to day. What we'd like to do it get rid of the noise and the yearly cycle, and find the longterm trend. There are lots of possible ways to do this, and none of them are necessarially the best. This assignment is going to be more openended than most. Your goal is to find a good model for the longterm COtrend and make some prediction about what the concentraion of COwill be in the future. The exercises below should be a guide through a mix of smoothing, fitlering and fitting, but how you want to get to the goals is mostly up to you.
aFrom what we saw in class on Oct. thyou should be able to load the daily data
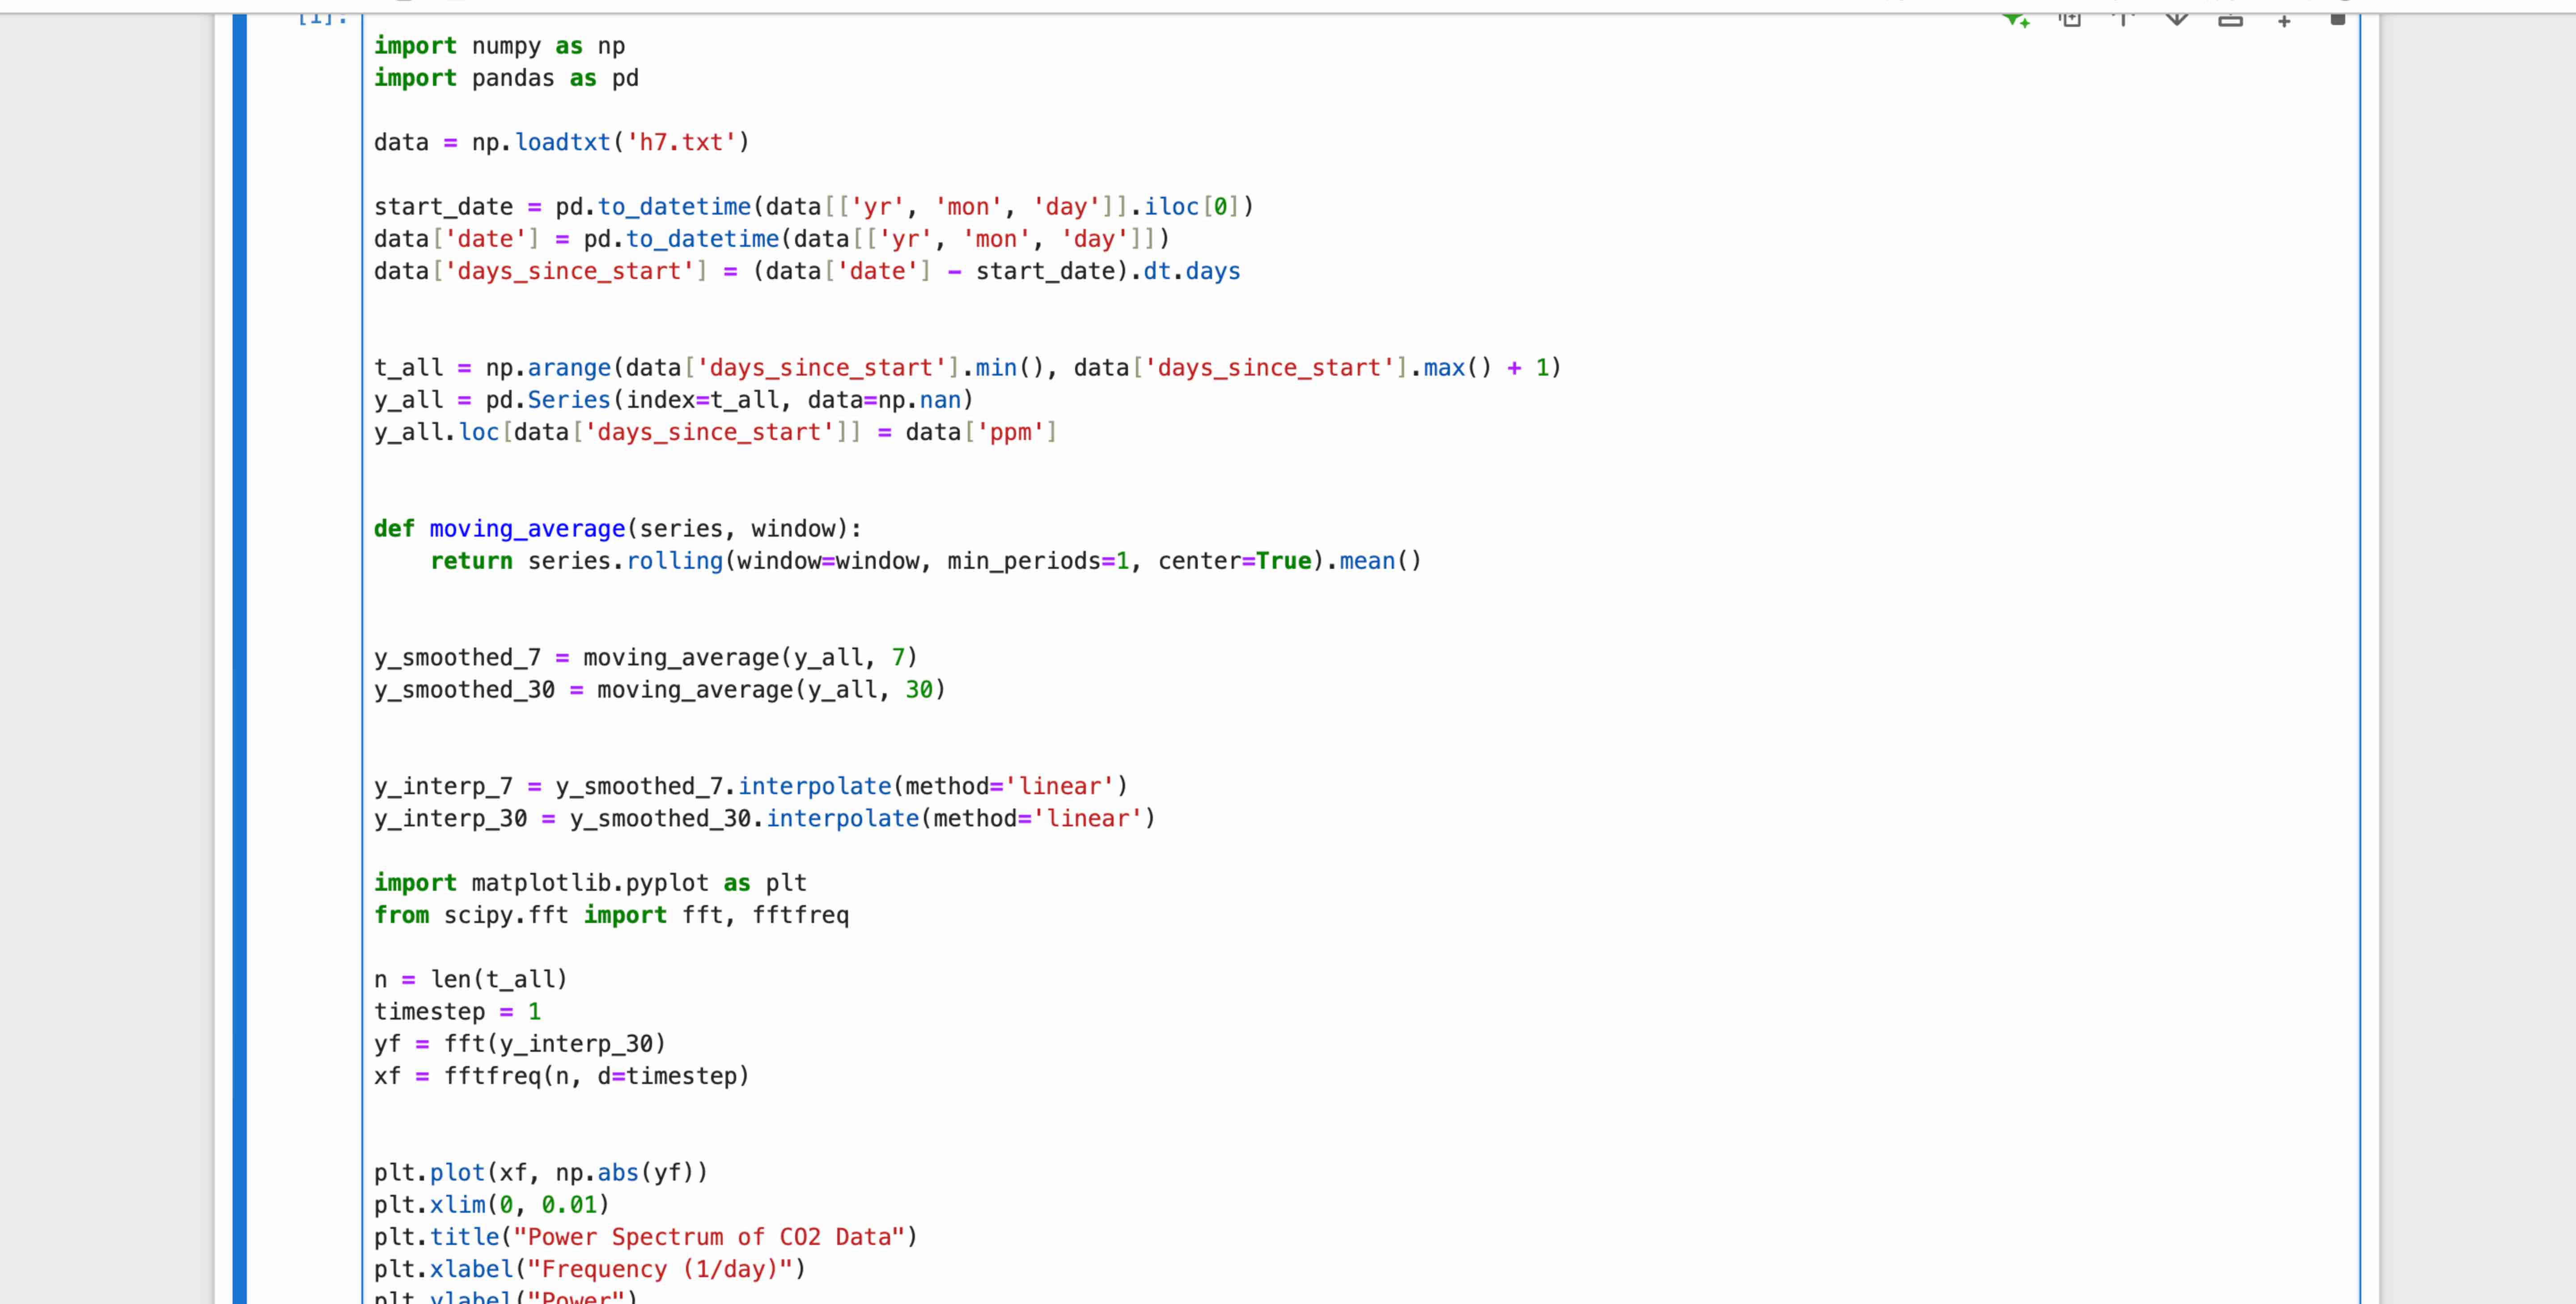
and match it to a day since the data began yn and tn in DrMorsonys notebookYou can also make an array of all the days covered by the data talland an array with the measurement for each data you have data yallbut there will be days without data. Deciding what to do with the missing data has a big impact on how we interperate our data, particularly if we want to use a Fourier transforms. In class, we tried filling in the missing data with zero, with the overall average, and with interpolated values. None of these worked particularly well, though interpolation did a bit better. One thing you could try is doing some smoothing of the data first, then interpolating to fill in the missing values. This might help get rid of some of the daily noise. Give the a try. Try smoothing somehow, maybe averaging over days or days then interpolate on the smoothed data to fill in the missing data. Then try a Fourier transfor and see what the poer spectrum looks like. Is it any cleaner?
bOnce you have a decent looking data series, try filtering out low frequencies less than a couple of years?and do an inverse Fourier transform, and see what it looks like. Is the behavior at the end any better?
cAnother approach is to try to smooth out the annual and dailyvariations rather than filter them out. Since we're assuming our data varied on a year timescale, try smoothing on a timescale of a year or more. Maybe a day moving average? Remember not to include the missing data in your smoothing.Find a good smoothing and plot your smoothed data. How does it compare to the filtered data from part b You can also reduce the number of data points, maybe take monthly or yearly averages rather than trying to fill in data at every point. dLast we want to use the longterm trend to make some predictions for the future. Fourier transformes of interpolation are probably going to be a bad way to do this, because they tend to vary a lot at the ends, or depend more heavily on the data near the end. That's bad if you're trying to go beyond the end. Instead, you'll probably need to do some sort of fitting. You might try fitting a polynomial or exponential plus polynomial, or some other function. Try fitting to the raw data, and some good smoothed or filtered data. If you're fitting data you've filtered, you might even want to cut off the ends. Pick what fit you think is "best". Then use your fit to make some predictions. What will the COconcentration be in in How good do you think your predictions are? Can you quantify that maybe notDo your predictions start behaving oddly at some pointegdo they start to decrease?
DATA:
Date COmolfrac
yrmon day, decimalppm
Code below error message
Step by Step Solution
There are 3 Steps involved in it
1 Expert Approved Answer
Step: 1 Unlock

Question Has Been Solved by an Expert!
Get step-by-step solutions from verified subject matter experts
Step: 2 Unlock
Step: 3 Unlock