

Question: HR How would you measure the efficiency and effectiveness of new methods of recruiting vs the traditional methods? 8 RECRUITMENT In this chapter we will
HR
How would you measure the efficiency and effectiveness of new methods of recruiting vs the traditional methods?
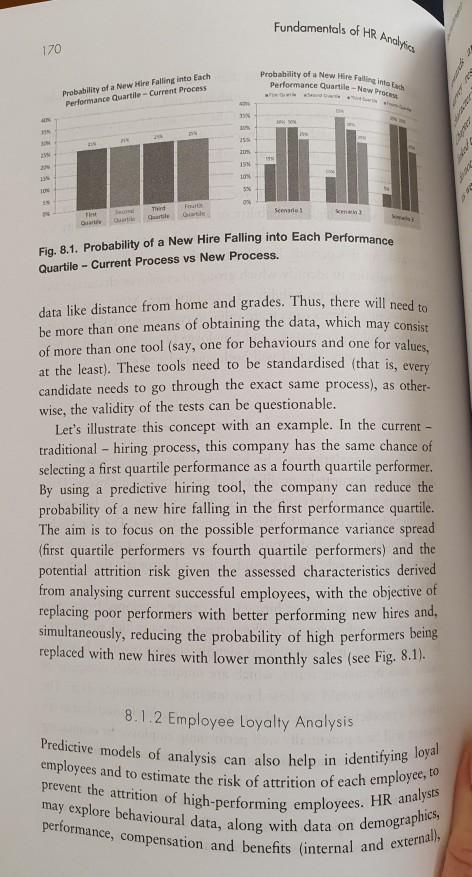
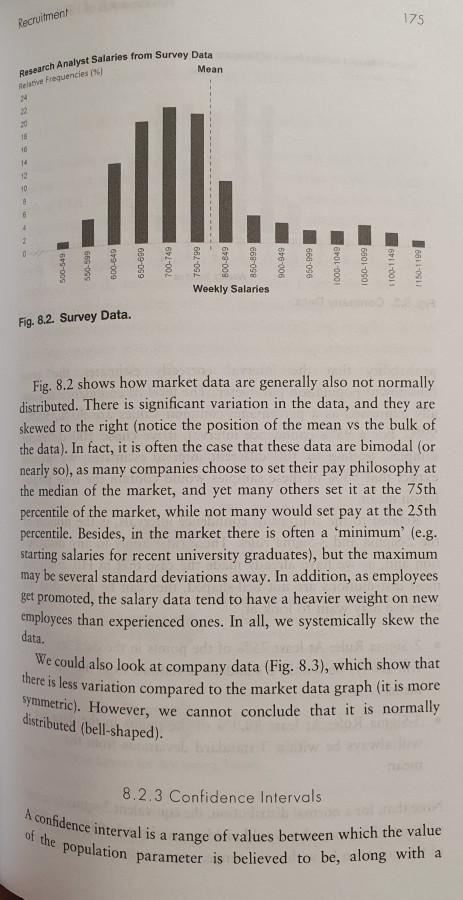
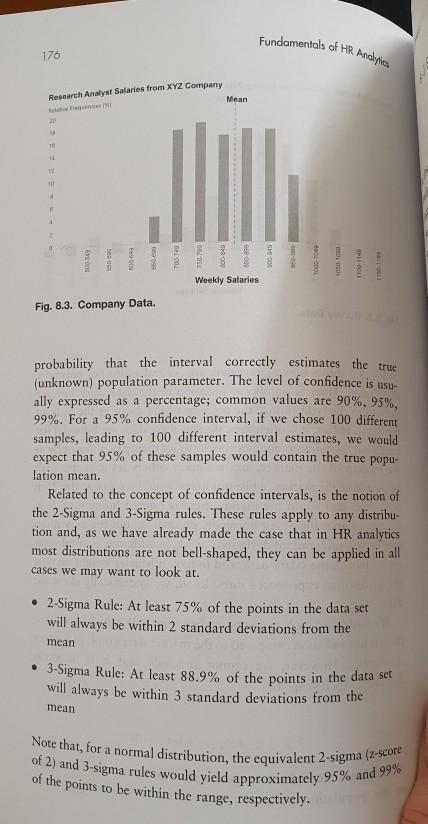
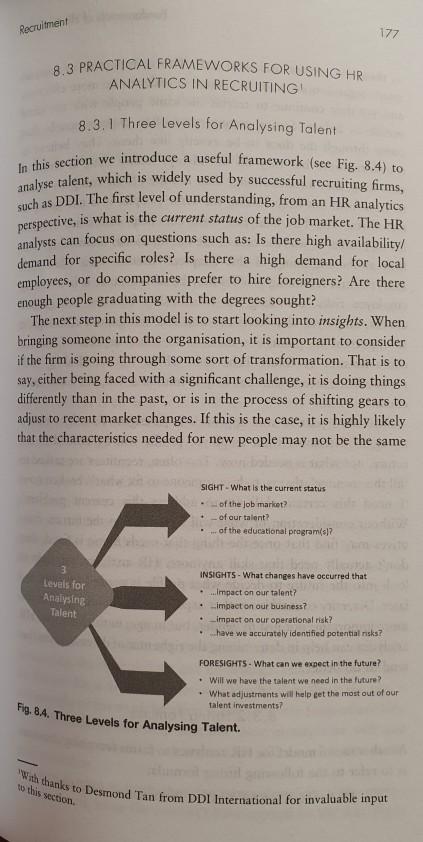

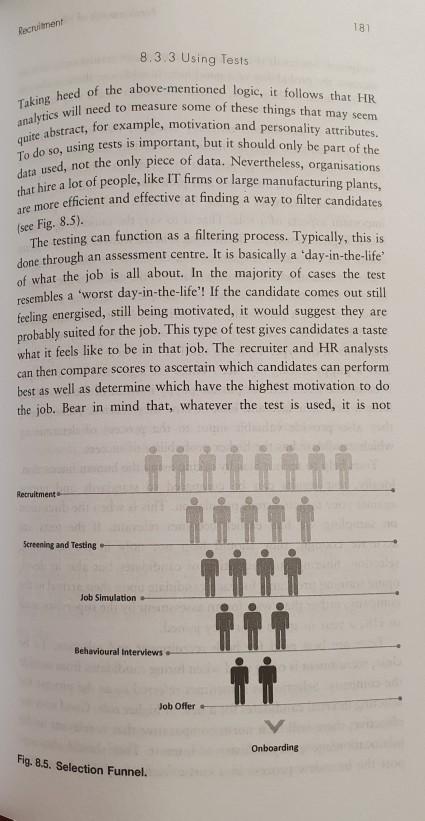
8 RECRUITMENT In this chapter we will turn our attention to the application of HR analytics in recruitment while, at the same time, reviewing some important concepts about the basics of sampling methods. Analytics in recruiting focuses a great deal on assessments: assessment testing, assessment centres, interviews, sussing out candidates both internal and external as well as development. To illustrate this point, it is worth looking at the case of a large financial services multinational company which was trying to determine how to hire the best possible sales staff. Up until that point, the firm operated under the belief that employees with good grades who come from highly ranked colleges would make good performers, and thus, their recruitment, selection and promotion processes were based on recruiting individuals who fit these aca- demic drivers. The HR analytics team went to work to determine if there was a correlation between good sales performance and these selection criteria. What they found was that the correlation was weak; where the candidate went to school, what cumulative grade point average (GPA) they had, the quality of the referees, these things did not make much difference in predicting their sales performance once they joined the company. The HR analytics team went to work to determine what the characteristics were of the top performing salespeople. What they found surprised them. Interestingly enough, having a grammatically correct resume was a predictor that an 167 individual can sell well. Having completed some educational degree, any degree, and at any institution, also made a difference. Having sold high-priced products before, and done it well, was also highly correlated with future performance. One last characteristic conditions. These were the few factors that correlated to future sales 168 Fundamentals of HR Analytics found to be significant was the ability to work under unstructured performance in this company in the markets in which they operate. 8.1 HR ANALYTICS IN RECRUITMENT In its simplest form, HR analytics can help to track the efficiency and effectiveness of the recruiting process. For instance, what is the cost per hire? Does it vary by channel (e.g. recruiting site vs agencies?). How about the quality of the hires: does it also vary by channel? If so, can any insights be drawn in terms of cost-benefit per recruiting channel? How diverse is the workforce in relation to the hiring pool? The efficiency of the process can be measured in terms of the time to fill jobs, and the number of new hires vs internal promotions for all non-entry-level jobs. HR analytics can also use data to assess potential candidates and improve the probability of a successful outcome of the recruitment process. There could be a whole host of reasons that make a new employee good. If these reasons were universal, as it is often assumed that a person from a good university is better than a person from a not-so-good university, and that a new graduate that has an 'A' average in his university courses is better than another that has a 'B' average. As long as there are assumptions like these in the recruiting process, then deciding whom to hire should be easy: only recruit from the top universities and only recruit people who have an 'A' average, and voila! But in reality, that may not be the right answer and HR analytics can help find better answers than that. In a typical recruiting process, candidates are chosen from a batch of CVs received, based on hiring criteria specified as requirements to perform at the job for which they are applying. The candidates are then asked to attend interviews by HR and the hiring manager, which, at best, are entrusted to assess fit' and 'technical Recruitment consensus to a skills, respectively. More often than not, there are no clear guide lines for selecting the right candidate and, in fact, there is no choose the best candidate. However, the recruiting process is akin throughput is the recruitment and selection process, and the include behaviours, as well as personal values, along with factual 169 beforehand about what the way would be to identify and manufacturing process, where the inputs are the candidates, the outcome is a quality employee (defined, for example, as an employee with a high probability of staying with the company for at least three years and with at least an 'on target performance appraisal for this period). By reframing the process this way, we can apply analytics to identify which group of employee characteristics can yield a higher probability of a quality hire. More specifically, recruitment analytics can create value in two main ways: Employee Profiling and Segmentation, and Employee Loyalty Analysis to help determine if a new recruit will both succeed and stay. 8.1.1 Employee Profiling and Segmentation Recruitment analytics can be leveraged for effective talent man- agement by accurately profiling and segmenting employees. Data (including traits, behaviours, skills, experience etc.) can be used to profile 'what success looks like' in a particular role. The knowledge and insights extracted from this segmentation process can be applied to effectively classify candidates and automate the screening process. For instance, predictive hiring tools can be developed by creating recruitment profiles based on the current company high performers. In other words, it is possible to identify success profiles, based on skills and behaviour traits, which are unique to each company as these profiles would be based on internal performance data. The aim of a predictive hiring tool is to increase the likelihood that every recruit will be a potentially well-performing employee by estimating their probability of success relative to the internal benchmark per- Note that it will be necessary to build a data set that comprises more than one type of information. The recruitment data set may formance profile. Probability of a New Hire Falling och Fig. 8.1. Probability of a New Hire Falling into Each Performance 170 Performance Quartile - New Process Probability of a New Hire Falling into Each Performance Quartile - Current Process IN 11 15 20 15 ton We ON Scenarios Quartile - Current Process vs New Process. Fundamentals of HR. Archics Predictive models of analysis can also help in identifying loyal employees and to estimate the risk of attrition of each employee, to prevent the attrition of high-performing employees. HR analysts may explore behavioural data, along with data on performance, compensation and benefits (internal and external), data like distance from home and grades. Thus, there will need to be more than one means of obtaining the data, which may consist of more than one tool (say, one for behaviours and one for values, at the least). These tools need to be standardised (that is, every candidate needs to go through the exact same process), as other- wise, the validity of the tests can be questionable. Let's illustrate this concept with an example. In the current - traditional - hiring process, this company has the same chance of selecting a first quartile performance as a fourth quartile performer. By using a predictive hiring tool, the company can reduce the probability of a new hire falling in the first performance quartile. The aim is to focus on the possible performance variance spread (first quartile performers vs fourth quartile performers) and the potential attrition risk given the assessed characteristics derived from analysing current successful employees, with the objective of replacing poor performers with better performing new hires and, simultaneously, reducing the probability of high performers being replaced with new hires with lower monthly sales (see Fig. 8.1). 8.1.2 Employee Loyalty Analysis demographics, Tank candidates, while providing a more engaging experience for 171 Recruitment as well. rewards and recognition, training, and employee engagement survey results, to determine if there are patterns in how these characteristics combine to increase the probability of turnover (see Chapter 5 on turnover). Remember that some of the characteristics linked to loyalty may be related to distance from home, etc., which do not require tools to assess, but need to be included in the analysis experience and/or background. The results, via comparison to the response pattern of successful current employees, can be used to evaluate candidate traits in assessing fit and potential for a position. 8.1.3 Use of Gamification in Recruiting Many organisations are less able to generate enough interest in their company to guarantee enough supply to their recruiting process, and thus a better pool of candidates to choose from. They may not have enough visibility of their company or jobs, as the market competition for new employees can, and often does, default to those companies with bigger brands or budgets. This can translate into a lack of continuous, strong pipeline, too many or ineffective sourc- ing channels and insufficient quality/diversity of candidates. Another common situation, especially in smaller, fast-growing companies, is the need to quickly assess candidates without taking too much managerial time. Additionally, many managers have both conscious and uncon- scious interview biases, are subjective in measuring potential and have varying levels of accuracy (and rater error) in assessing can- didates with transferrable skills. HR analytics has allowed for the use of gamification to provide a data-driven approach to make informed recruitment decisions. Using the predetermined, unique company traits identified, the current employees play a decision-making game and patterns of responses are observed. Candidates are later screened into the recruitment process based on gameplay, rather than their previous candidates. pling plan is the approach to be used to obtain samples from roughly like this: Fundamentals of HR Andies cognitive and emotional traines not just resumes, to predict person and job fit. The process looks 2. Identify 30-50 existing successful employees to set profile baseline 3. Develop benchmark performance profiles of roles and flag high 8.2 BASICS OF EMPLOYEE SAMPLING METHODS Sampling is the foundation of statistical analysis, whereas a sami 172 In summary, HR analytics uses 1. Identify target candidate pool for assessment. performers. 4. Current employees participate in assessments/games and responses/patterns are recorded. 5. Validate models developed. 6. Candidates participate in assessments/games and are ranked by fit with high performer model. Note that, as indicated, the probability of ending with a good hire increases, to a point, with the number of tests. Interviews, assess- ments, data analysis, each by themselves may only give you a 50% probability, but the combination of the several tests may push the overall probability to over 70%. This is already a marked improvement over interviews alone! By virtue of these combined results, the recruiter may end up with three candidates with a probability of success between 72% and 74%. Then, the recruiter can introduce these candidates to the hiring manager with the notion that at that point, any of them has an equivalent chance of success. Before continuing, we should take time to provide enough background on statistical sampling, which will be useful in doing analytics for recruitment. 8.2.1 Sampling Plans population prior to any data collection activity. Most probabilistic sampling, on the other hand, is often categorised as simple random sampling, whereby items are selected from a population so that every subset of a given size has an equal chance Recruitment 173 A sampling plan should include: Objectives . Target population Population frame Procedures to collect data Statistical tools for data analysis The following example will help understand these concepts. A company wants to know how managers might respond to a lead- ership program: . Objective: estimate the proportion of managers who would join the program . Target Population managers with less than two-year tenure in position Population Frame: managers who graduated from Singapore Management University Procedure: email link to survey or direct-mail questionnaire Statistical tools: summary of data by demographics and esti- mated likelihood of joining There are two basic methods for sampling: Subjective and Proba- bilistic. Subjective methods can be broadly divided into two approaches: Judgement sampling: expert judgement is used to select the sample Convenience sampling: samples are selected based on the ease with which the data can be collected of being selected. likely to fail as well since the population is not normally distributed error is reliability. Fundamentals of HR Analyes It is important to always remember that samples are subsets of the total population, and not the total population. Therefore, a sampling (statistical) error is inherent in any sampling process which can be minimised, but not avoided. A non-sampling said to occur when the sample does not represent the population well. This usually results from poor sample design or low data distribution of all, the forced ranking in performance management To be truly normally distributed, the tails on both side (significantly above target and significantly below target) would have to be equal; performers than worse performers. This is because we systemati- cally seek to eliminate poor performers from the company and retain good ones. Thus, the data are skewed. Even in sales compensation, we seek to do the same, so the central theorem is 174 8.2.2 Sampling Distributions and the Central Limit Theorem from an HR Analytics Perspective The sampling distribution of the mean is the distribution of the means of all possible samples of a fixed size n from a given popu- lation. The standard deviation of the sampling distribution of the mean is called the standard error of the mean. As n increases, the standard error decreases - larger sample sizes have less sampling The Central Limit theorem states that, ideally, if the sample size is large enough, then the sampling distribution of the mean can be said to be approximately normally distributed regardless of the distri- bution of the population, and with a mean equal to the population mean. If the population is normally distributed, then the sampling distribution is also normally distributed for any sample size. However, in HR analytics world, we should not so readily conclude that data are normally distributed, despite the central limit theorem. The reason is that, for most of what HR does, the data are generally skewed. Take, for instance, the most vaunted "normal error. to begin with of the population parameter is believed to be, along with a Recruitmeni 175 Research Analyst Salaries from Survey Data Mean Relative Frequencies 11 12 10 500-549 550-599 600-549 650-699 700-749 750-799 300-849 5850-899 900-949 665-096 BOL-0001 1050-1099 103-1149 6611-0911 Fig. 8.2. Survey Data. symmetric). However, we cannot conclude that it is normally A confidence interval is a range of values between which the value Weekly Salaries Fig. 8.2 shows how market data are generally also not normally distributed. There is significant variation in the data, and they are skewed to the right (notice the position of the mean vs the bulk of the data). In fact, it is often the case that these data are bimodal (or nearly so), as many companies choose to set their pay philosophy at the median of the market, and yet many others set it at the 75th percentile of the market, while not many would set pay at the 25th percentile. Besides, in the market there is often a minimum (e.g. starting salaries for recent university graduates), but the maximum may be several standard deviations away. In addition, as employees get promoted, the salary data tend to have a heavier weight on new employees than experienced ones. In all, we systemically skew the We could also look at company data (Fig. 8.3), which show that there is less variation compared to the market data graph (it is more 8.2.3 Confidence intervals data. distributed (bell-shaped). Fundamentals of HR Anchies Note that, for a normal distribution, the equivalent 2-sigma (2-score of 2) and 3-sigma rules would yield approximately 95% and 99% 176 Research Analyst Salaries from XYZ Company Mean 20 TH TU Weekly Salaries Fig. 8.3. Company Data. probability that the interval correctly estimates the true (unknown) population parameter. The level of confidence is usu- ally expressed as a percentage; common values are 90%, 95%, 99%. For a 95% confidence interval, if we chose 100 different samples, leading to 100 different interval estimates, we would expect that 95% of these samples would contain the true popu- lation mean. Related to the concept of confidence intervals, is the notion of the 2-Sigma and 3-Sigma rules. These rules apply to any distribu- tion and, as we have already made the case that in HR analytics most distributions are not bell-shaped, they can be applied in all cases we may want to look at. 2-Sigma Rule: At least 75% of the points in the data set will always be within 2 standard deviations from the mean 3-Sigma Rule: At least 88.9% of the points in the data ser will always be within 3 standard deviations from the mean of the points to be within the range, respectively. Fig. 8A. Three Levels for Analysing Talent. with thanks to Desmond Tan from DDI International for invaluable input Recruitment 177 8.3 PRACTICAL FRAMEWORKS FOR USING HR In this section we introduce a useful framework (see Fig. 8.4) to analyse talent, which is widely used by successful recruiting firms, such as DDI. The first level of understanding, from an HR analytics perspective, is what is the current status of the job market. The HR ANALYTICS IN RECRUITING 8.3.1 Three levels for Analysing Talent analysts can focus on questions such as: Is there high availability/ demand for specific roles? Is there a high demand for local employees, or do companies prefer to hire foreigners? Are there enough people graduating with the degrees sought? The next step in this model is to start looking into insights. When bringing someone into the organisation, it is important to consider if the firm is going through some sort of transformation. That is to say, either being faced with a significant challenge, it is doing things differently than in the past, or is in the process of shifting gears to adjust to recent market changes. If this is the case, it is highly likely that the characteristics needed for new people may not be the same SIGHT - What is the current status of the job market? of our talent? of the educational program(s)? 3 Levels for Analysing Talent INSIGHTS - What changes have occurred that ...Impact on our talent? -impact on our business? Limpact on our operational risk? have we accurately identified potential risks FORESIGHTS - What can we expect in the future? Will we have the talent we need in the future? What adjustments will help get the most out of our talent investments? to this section PEA X B&CX K&EX MF = Performance on the Job Fundamentals of HR Analytics 178 effective, as those for current successful staff. This is important to note, as many organisations want to change in order to be more and yet they continue to recruit the same people with the same profile as before. Senior management often expects people that come through the door to be exactly like them: They believe in transformation, but they do not always realise that, in terms of recruiting, they have to change their mindset: If the company wants Another useful model for HR analytics to frame recruiting decisions to transform but keeps hiring the same people, it is not going to transform. The HR analytics team can help determine a better hiring profile, as was the case of the multinational financial services firm at the beginning of this chapter. Another area where HR analytics and recruiting profiles may be of assistance is in assessing employee risks, including the relationship between background checks, employee characteristics and risk mitigation. Although it is important to point out that, as in other aspects of current characteristics vs future behaviour where we are dealing with probabilities, assessments can help to minimise risk, but it can never eliminate risk. The third part of this approach is foresight. Foresight means trying to determine what employee profile will be needed in the future, not what is needed now. Too often, recruiters are tasked to "fill the vacancy', that is, to hire someone to fix what's broken now: "I need this certain skill set to address this current problem'. Without consideration of what will be needed in the future, exec- utives may find that once the thing that needs fixing is fixed, they don't actually need that skill anymore. HR analytics can help to look into the future to decide what profile is needed for now and later. Diversity of staff is another aspect that is becoming more and more important: not just in gender, but in age, in thinking, etc.HR analytics can help in determining the right mix of diverse teams that 8.3.2 Hiring Formula tend to do better. is to refer to the following hiring formula: Recruitment where: B&C - . K&E - MF- . P&A - Personality and Attributes In this formula, the first main criteria are personality and attributes - who the candidate is and how this may impact their success on the job. For instance, when recruiting for a highly hierarchical company, where entry-level tasks are simple and determine the probability of success, or at least of retention, of Often, a point is made that, for motivational fit, if the person isn't interested, he or she wouldn't have applied for the job. There 170 Behaviours and Competencies Knowledge and Experience Motivational Fit volume-driven, it may not serve to recruit individuals who are very talkative and enjoy socialising. Will this type of candidates be successful in this environment? Unlikely. Chances are they are going to be frustrated and may end up leaving the business on short notice. Knowing what type of personality and attributes drive on- the-job success is an area where HR analytics can help. Next is behaviours and competencies - what is the candidate capable of doing, their skill set, coupled with their knowledge and experience, what they know. Note that knowing and being able to do are two very different things. One very simple example: A person can do a search on YouTube on how to do a brain surgery and learn all the steps in the right order. Can they proceed to put a patient under anaesthesia and perform the surgery? Not likely, they don't have the skill, even if they have the knowledge. This aspect is also an area where HR Analytics can support the recruiting and The last criterion in the formula is motivation: does the employee want to do the job? Candidates may have the right personality, the right skill set and knowledge, but may not want to do this job for a variety of reasons. Maybe they think the pay is not enough, or the work location is too far away from where they live HR analytics can help suss out these elements as well and selection process. cach candidate. Fundamentals of HR Analytica 180 enough to do this, there is a point where the answer is yes, y But they may also want are many who think money is the main motivation to take a new job. In other words, even if a candidate says: "you can't pay me proposed pay doubled/tripled/ten times? But, most of the time, money is not the only motivator. Take, for instance, a fresh grad uate: what motivated them? It could be that they are mostly motivated by money because they want to start earning their own place less emphasis on skill. On other jobs, for example payroll accounting, candidates are expected to apply their skills immedi- ately the day they walk in. If so, skill becomes more importanr. It depends on the job and it may depend on the organisation's needs and expectations as well; will they pay a candidate to leam? even if area is off, the candidate may still have a reasonable chance A consequence of the multiplicative nature of the formula is that instead of taking money from their parents. to get into a role where they feel they are learning, contributing and adding value. Others may be keener on the reputation of the firm and how it reflects on them/looks on their CV ("If I got into Google, I must be good! Let me post it online and let everybody know!). Sometimes, even if the candidate is not initially motivated, the firm can find a way to provide the motivation, by re-designing the job, adjusting the job title, allowing for more work-from-home sched- uling, etc. Thus, future success depends on motivation and HR analytics can help to uncover this. The formula uses a multiplier among these criteria to emphasise the point that each of these criteria increases someone's chance of success of the job. So, if a candidate has the right personality, it makes a big difference if they also have the right skill and knowl- edge. And if they have the right skill and the right personality, it makes a big difference when they also have the right motivation. The weightage assigned to each criterion will depend on the requirements of the job. For example, a consulting executive may weigh personality and motivational fit higher than the others because, in this environment, it may be that if the candidate is really intent on a consulting career and has the right personality, they will pick up the required skills. If the firm does not expect a fresh graduate to come in and be able to consult immediately, they can of success if they have everything else right. Taking heed of the above-mentioned logic, it follows that HR analytics will need to measure some of these things that may seem quite abstract, for example, motivation and personality attributes. To do so, using tests is important, but it should only be part of the data used, not the only piece of data. Nevertheless, organisations that hire a lot of people, like IT firms or large manufacturing plants, are more efficient and effective at finding a way to filter candidates Recruitment 181 8.3.3 Using Tests see Fig. 8.5). The testing can function as a filtering process. Typically, this is done through an assessment centre. It is basically a 'day-in-the-life of what the job is all about. In the majority of cases the test resembles a 'worst day-in-the-life'! If the candidate comes out still feeling energised, still being motivated, it would suggest they are probably suited for the job. This type of test gives candidates a taste what it feels like to be in that job. The recruiter and HR analysts can then compare scores to ascertain which candidates can perform best as well as determine which have the highest motivation to do the job. Bear in mind that, whatever the test is used, it is not Recruitment Screening and Testing Job Simulation Behavioural Interviews Job Offer Onboarding Fig. 8.5. Selection Funnel. perform Fundamentals of HR Analytics foolproof. No result is ever 100% accurate, as results only aim to increase the probability of a good hire. In addition, there is always the likelihood of sheer luck, or that candidates find a way to game signs and samples. Signs are measures of factors that may influence company, rather than wait for an assessment by the supervisor and/ Tests are best used for both recruitment and selection. To be clear, recruitment is often used when hiring candidates from outside selecting internal candidates for a new or higher role. Good tests are objective; there will be a norm comparative that is relevant to the job/location/age group/industry of interest. They should also sup port the interview process in a cost-effective way. Used correctly, 182 the system. Results of assessments normally comprise two main elements an individual's ability to perform in a role. In other words, the underlying abilities, attributes and preferences. Samples are obser- vations and examples of an individual's ability to important aspects of a role. That is to say, the underlying behav- jours. Typically, whether the filtering is in the form of an assessment centre or a situational judgement test, decisions are made based on a given situation which is closely related to the decisions they would have to make on the job. That is a sample. A sign, on the other hand, is a trait, a personality and attribute. Most personality tests like DISC, MBTI, etc. rely only on signs. Personality tests ask questions of the type: 'I like the smell of roses in the morning, or 'l hate a puppy licking my face'. Those are signs and not a sample because the tester did not put the puppy in front of the candidate, have it lick their face and look at how they reacted. Nonetheless, they also provide valuable input to the process of determining which candidate has the higher probability of success. Tests help to reduce bias by taking away the human interaction. Ideally, test results can be compared to standards and norms against your target/current population. This is when the discussion on sampling we had earlier becomes relevant. If the tests are accurate enough, they should help not only in the screening selection, filtering and recruiting of candidates but also in devel- oping training programs for each candidate upon their arrival in the or HR, a year or more after they joined. the company. Selection is sometimes referred to as the process for rests constitute a valid selection technique. On the other hand, some of the disadvantages include the following: There are a few categories of tests in the workplace, namely, Personality/Behaviours tests, Interests/Motives tests, Cognitive Administration time, which may be longer than interviews in Abilities tests and a broad array of other types of tests. 183 Firen some cases, Valid tests in some cases require a comprehensive job analysis to understand the job before the test can be designed and built. . Cost of materials and training can sometimes be an issue. . There can also be potential legal issues if tests are not used correctly; for instance, if used as the sole basis for hiring and selection decisions, as the test can be biased and, as mentioned before, not meant to be used by itself but as a means to support the rest of the process. In some cases, there are people with tests anxiety, not good at taking tests which will affect their results. Sometimes candidates can cheat, some because they can ask people who took the test previously, or they can get copies on the internet (this is particularly true if the tests are over- exposed), or if left alone in a room, they can ask other candi- dates or look at their answers. Tests that are not well designed, run into validity and prediction issues. Note that the cost of an assessment centre is different than for a test. An assessment centre can cost up to a five-figure sum per person. A test is typically two to three figures. Assessment centres are best used for senior-level hires: CEO selection, heads of department and the like. 8.3.4 Assessments in the Workplace recruitment, along with the basics of sampling methods. The key Fundamentals of HR Analytica 184 occupa- Personality assessments aim to describe aspects of an individuals characteristics (patterns of behaviour, thoughts, feelings) that remain stable throughout the individual's lifetime, and how these are expressed at the workplace. There are a large number of valid personality tests available. Some of the more well-known include DISC, MBTI, five-factor model and the trait model. All of them have their own theoretical basis and all of them can claim to have validity, reliability and generalisability over the domain they test. A personality test aims to highlight an individual's traits (is the person big-picture person, etc.) so they can be correlated with on-the-job In this chapter we covered the application of data and analytics in an introvert/extrovert , is the candidate a detail-oriented person ora performance. Interest inventories help identify career interests and tional themes. Motives/Values inventories assess the core goals, values, drivers and interests that determine what we desire and strive to attain. These are mostly used for career coaching. For instance, most universities with a career coaching department will have one or more of these inventories which students can take to help them understand what career/job they should want to do. Cognitive ability tests assess an individual's mental abilities or processes to carry out simple complex tasks linked to how we learn, remember and solve problems. This is a traditional choice of many organisations: Is this person smart? Can they reason? Can they analyse, etc? There are a host of other assessment tests available. Many of them are skills tests to assess basic skills such as customer handling, typing, manual skills, IT applications, etc. Included in this category are also Situational Judgement Tests for many different types of career bat- tery assessment. For example, for assessing nurses, it is possible to use a nursing career battery, a team-career battery, professional- career battery, etc., all related to expectations for success in that profession. These are often also normed and validated globally. SUMMARY message is that HR analytics can be of help in recruiting by helping the hiring manager and the recruiting function to hire the best possible pool of candidates based on data; not gut feel or 'intuition'. However, we also discussed that no single tool is the BEST pre- dictor: It is therefore important to use a holistic approach involving Recruitment 185 decisions. more than one test/tool to arrive at more robust recruiting One closing thought for this chapter is the idea that HR analytics can help determine how recruiting metrics could be a predictor or antecedent for business performance. For instance, there is some evidence to support the idea that boards and companies that are more diverse (in terms of employee profile) outperform those that are homogeneous. By finding how this relationship works in the company (see the discussion at the end of Chapter 1), HR analytics can help add value to the company by helping to determine the optimum level of diversity
Step by Step Solution
There are 3 Steps involved in it
1 Expert Approved Answer
Step: 1 Unlock

Question Has Been Solved by an Expert!
Get step-by-step solutions from verified subject matter experts
Step: 2 Unlock
Step: 3 Unlock