

Question: hr ieves Casting Company is considering adding a new line to its product mix. The production line would be set up in unused space in
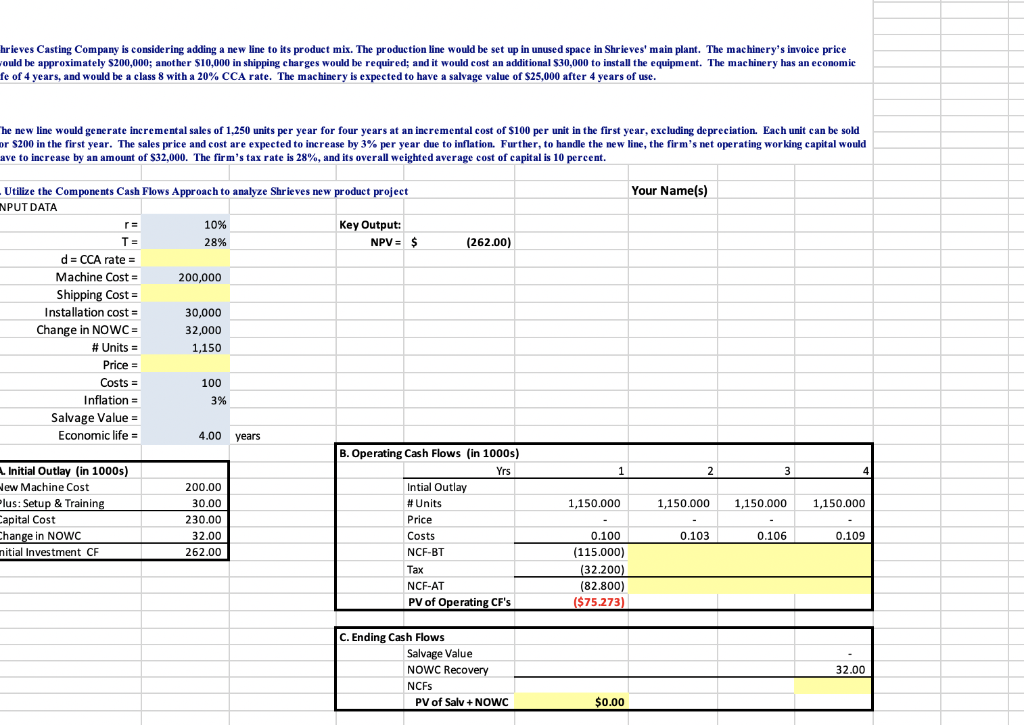
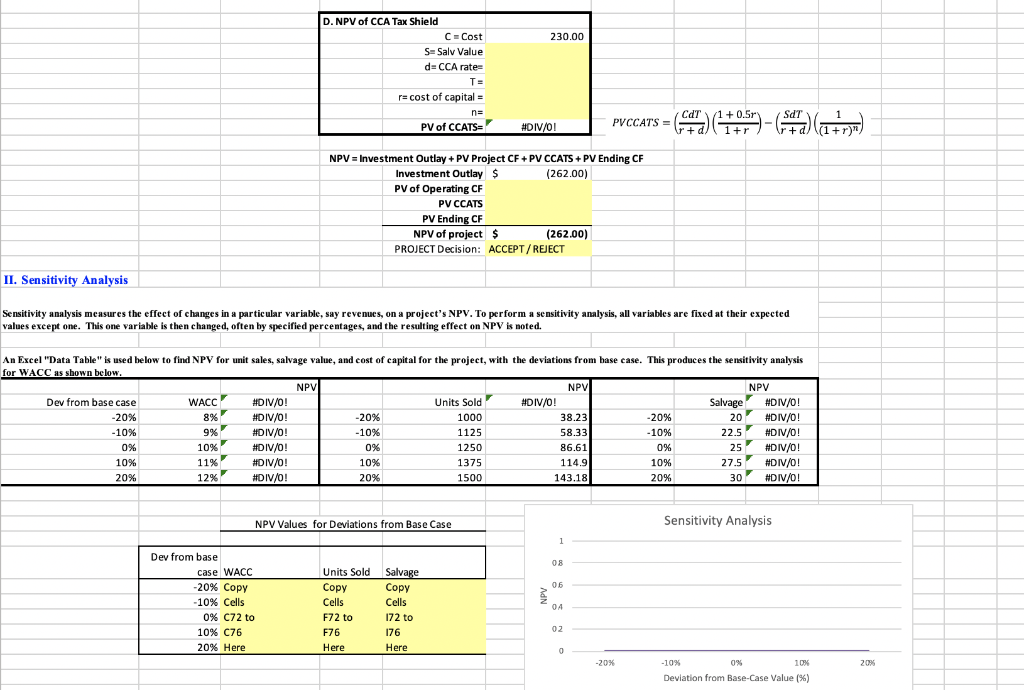
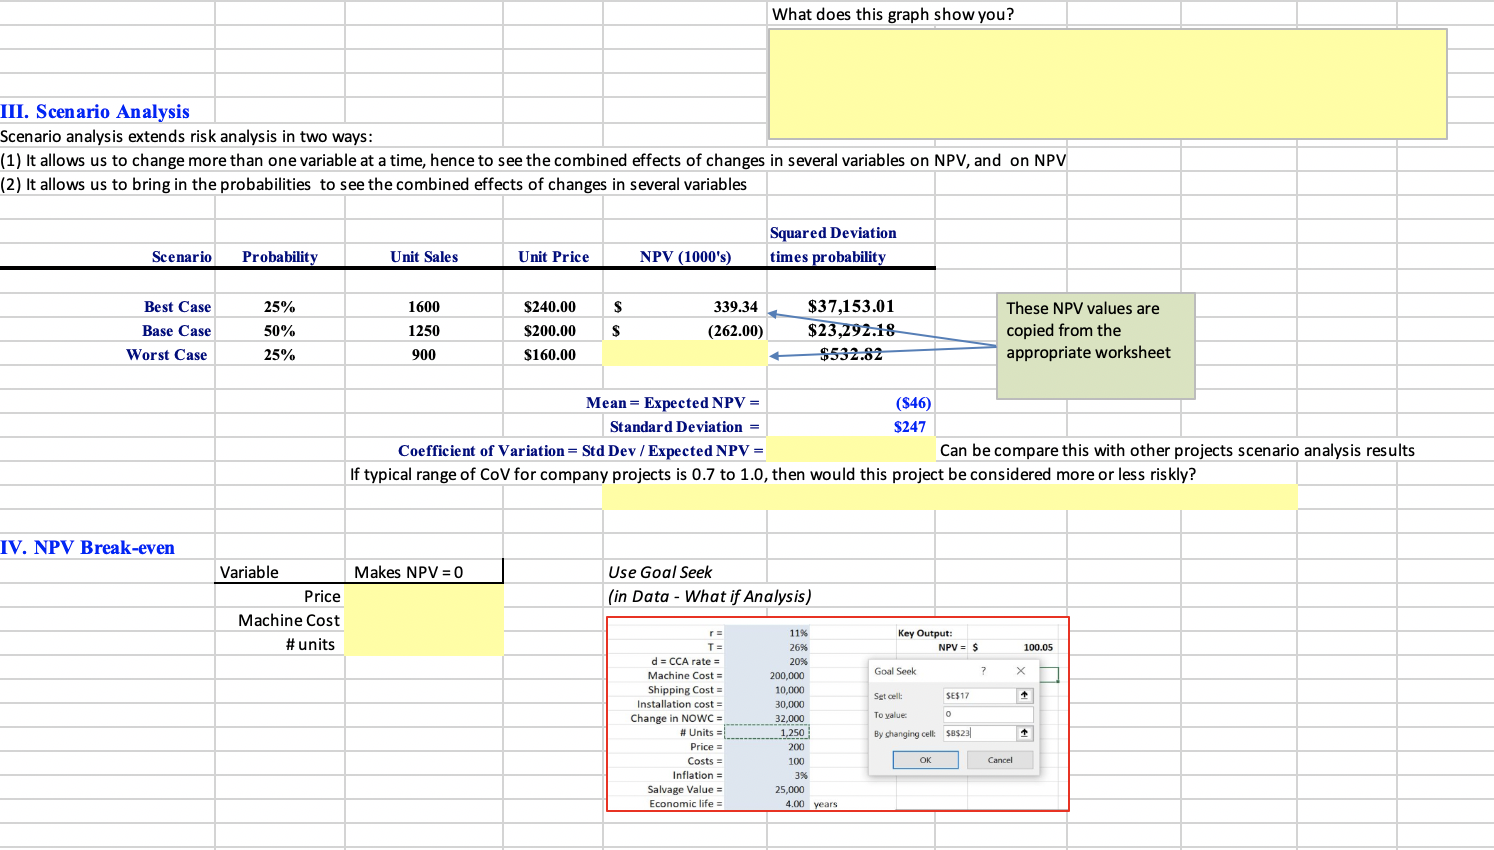
hr ieves Casting Company is considering adding a new line to its product mix. The production line would be set up in unused space in Shrieves' main plant. The machinery's invoice price would be approximately $200,000; another $10,000 in shipping charges would be required; and it would cost an additional $30,000 to install the equipment. The machinery has an economic fe of 4 years, and would be a class 8 with a 20% CCA rate. The machinery is expected to have a salvage value of $25,000 after 4 years of use. The new line would generate incremental sales of 1,250 units per year for four years at an incremental cost of $100 per unit in the first year, excluding depreciation. Each unit can be sold or $200 in the first year. The sales price and cost are expected to increase by 3% per year due to inflation. Further, to handle the new line, the firm's net operating working capital would ave to increase by an amount of $32,000. The firm's tax rate is 28%, and its overall weighted average cost of capital is 10 percent. Your Name(s) Utilize the Components Cash Flows Approach to analyze Shrieves new product project NPUT DATA 10% Key Output: 28% NPV = $ (262.00) d = CCA rate = Machine Cost = 200,000 Shipping Cost = Installation cost = 30,000 Change in NOWC = 32,000 # Units = 1,150 Price = Costs = 100 Inflation = 3% Salvage Value = Economic life = 4.00 years B. Operating Cash Flows (in 1000s) Initial Outlay (in 1000s) Yrs Hew Machine Cost 200.00 Intial Outlay Plus: Setup & Training 30.00 # Units Capital Cost 230.00 Price Change in NOWC 32.00 Costs nitial Investment CF 262.00 NCF-BT Tax NCF-AT PV of Operating CF's 1 23 1,150.000 1,150.000 1,150.000 1,150.000 0.103 0.106 0.109 0.100 (115.000) (32.200) (82.800) ($75.273) C. Ending Cash Flows Salvage Value NOWC Recovery NCFS PV of Salv + NOWC 32.00 $0.00 230.00 D. NPV of CCA Tax Shield C - Cost S=Salv Value d=CCA rate r= cost of capital = PV of CCATS #DIV/0 pvccars = (10) 41 0 5) - (A) (a+b)) NPV = Investment Outlay + PV Project CF + PV CCATS +PV Ending CF Investment Outlay $ (262.00) PV of Operating CF PV CCATS PV Ending CF NPV of project $ (262.00) PROJECT Decision: ACCEPT/REJECT II. Sensitivity Analysis Sensitivity analysis measures the effect of changes in a particular variable, say revenues, on a project's NPV. To perform a sensitivity analysis, all variables are fixed at their expected values except one. This one variable is then changed, often by specified percentages, and the resulting effect on NPV is noted. An Excel "Data Table" is used helow to find NPV for unit sales, salvage value, and cost of capital for the project, with the deviations from base case. This produces the sensitivity analysis for WACC as shown below. NPL NPV NPV Dev from base case WACC #DIV/0! Units Sold #DIV/0! Salvage #DIV/0! -20% 8% #DIV/0! -20% 1000 38.231 -20% 20 #DIV/0! -10% 9% #DIV/0! -10% 1125 58.33 -10% 22.5 #DIV/0! 0% 10% #DIV/0! 0% 1250 86.61 0% 25 #DIV/0! 10% 11% #DIV/0! 10% 1375 114.9 10% 27.5 #DIV/0! 20% 12% #DIV/0! 20% 1500 143.18 20% 30 #DIV/0! NPV Values for Deviations from Base Case Sensitivity Analysis Dev from base case WACC -20% Copy -10% Cells 0% 072 to 10% 076 20% Here Units Sold Copy Cells F72 to NPV Salvage Copy Cells 172 to 176 Here F76 Here -20% -10% 0% 10% Deviation from Base-Case Value (%) What does this graph show you? III. Scenario Analysis Scenario analysis extends risk analysis in two ways: (1) It allows us to change more than one variable at a time, hence to see the combined effects of changes in several variables on NPV and on NPV (2) It allows us to bring in the probabilities to see the combined effects of changes in several variables L Squared Deviation times probability Scenario Probability Unit Sales Unit Price NPV (1000's) Best Case Base Case Worst Case 25% 50% 25% 1600 1250 900 $240.00 $200.00 $160.00 339.34 (262.00) $ $37,153.01 $23,292.18 $532.82 These NPV values are copied from the appropriate worksheet Mean= Expected NPV = (846) Standard Deviation = $247 Coefficient of Variation=Std Dev / Expected NPV = Can be compare this with other projects scenario analysis results If typical range of CoV for company projects is 0.7 to 1.0, then would this project be considered more or less riskly? IV. NPV Break-even Makes NPV = 0 Use Goal Seek (in Data - What if Analysis) Variable Price Machine Cost #units ra Key Output: NPV = $ 100.05 Goal Seek SE$17 d = CCA rate= Machine Costa Shipping Cost = Installation cost = Change in NOWC = # Units = Price = Costs = Inflation = Salvage Value = Economic life = 11% 26% 20% 200,000 10,000 30,000 32,000 1,250 200 100 3% 25,000 4.00 Set cell: To value By changing cell D OK $B$23 Cancel years hr ieves Casting Company is considering adding a new line to its product mix. The production line would be set up in unused space in Shrieves' main plant. The machinery's invoice price would be approximately $200,000; another $10,000 in shipping charges would be required; and it would cost an additional $30,000 to install the equipment. The machinery has an economic fe of 4 years, and would be a class 8 with a 20% CCA rate. The machinery is expected to have a salvage value of $25,000 after 4 years of use. The new line would generate incremental sales of 1,250 units per year for four years at an incremental cost of $100 per unit in the first year, excluding depreciation. Each unit can be sold or $200 in the first year. The sales price and cost are expected to increase by 3% per year due to inflation. Further, to handle the new line, the firm's net operating working capital would ave to increase by an amount of $32,000. The firm's tax rate is 28%, and its overall weighted average cost of capital is 10 percent. Your Name(s) Utilize the Components Cash Flows Approach to analyze Shrieves new product project NPUT DATA 10% Key Output: 28% NPV = $ (262.00) d = CCA rate = Machine Cost = 200,000 Shipping Cost = Installation cost = 30,000 Change in NOWC = 32,000 # Units = 1,150 Price = Costs = 100 Inflation = 3% Salvage Value = Economic life = 4.00 years B. Operating Cash Flows (in 1000s) Initial Outlay (in 1000s) Yrs Hew Machine Cost 200.00 Intial Outlay Plus: Setup & Training 30.00 # Units Capital Cost 230.00 Price Change in NOWC 32.00 Costs nitial Investment CF 262.00 NCF-BT Tax NCF-AT PV of Operating CF's 1 23 1,150.000 1,150.000 1,150.000 1,150.000 0.103 0.106 0.109 0.100 (115.000) (32.200) (82.800) ($75.273) C. Ending Cash Flows Salvage Value NOWC Recovery NCFS PV of Salv + NOWC 32.00 $0.00 230.00 D. NPV of CCA Tax Shield C - Cost S=Salv Value d=CCA rate r= cost of capital = PV of CCATS #DIV/0 pvccars = (10) 41 0 5) - (A) (a+b)) NPV = Investment Outlay + PV Project CF + PV CCATS +PV Ending CF Investment Outlay $ (262.00) PV of Operating CF PV CCATS PV Ending CF NPV of project $ (262.00) PROJECT Decision: ACCEPT/REJECT II. Sensitivity Analysis Sensitivity analysis measures the effect of changes in a particular variable, say revenues, on a project's NPV. To perform a sensitivity analysis, all variables are fixed at their expected values except one. This one variable is then changed, often by specified percentages, and the resulting effect on NPV is noted. An Excel "Data Table" is used helow to find NPV for unit sales, salvage value, and cost of capital for the project, with the deviations from base case. This produces the sensitivity analysis for WACC as shown below. NPL NPV NPV Dev from base case WACC #DIV/0! Units Sold #DIV/0! Salvage #DIV/0! -20% 8% #DIV/0! -20% 1000 38.231 -20% 20 #DIV/0! -10% 9% #DIV/0! -10% 1125 58.33 -10% 22.5 #DIV/0! 0% 10% #DIV/0! 0% 1250 86.61 0% 25 #DIV/0! 10% 11% #DIV/0! 10% 1375 114.9 10% 27.5 #DIV/0! 20% 12% #DIV/0! 20% 1500 143.18 20% 30 #DIV/0! NPV Values for Deviations from Base Case Sensitivity Analysis Dev from base case WACC -20% Copy -10% Cells 0% 072 to 10% 076 20% Here Units Sold Copy Cells F72 to NPV Salvage Copy Cells 172 to 176 Here F76 Here -20% -10% 0% 10% Deviation from Base-Case Value (%) What does this graph show you? III. Scenario Analysis Scenario analysis extends risk analysis in two ways: (1) It allows us to change more than one variable at a time, hence to see the combined effects of changes in several variables on NPV and on NPV (2) It allows us to bring in the probabilities to see the combined effects of changes in several variables L Squared Deviation times probability Scenario Probability Unit Sales Unit Price NPV (1000's) Best Case Base Case Worst Case 25% 50% 25% 1600 1250 900 $240.00 $200.00 $160.00 339.34 (262.00) $ $37,153.01 $23,292.18 $532.82 These NPV values are copied from the appropriate worksheet Mean= Expected NPV = (846) Standard Deviation = $247 Coefficient of Variation=Std Dev / Expected NPV = Can be compare this with other projects scenario analysis results If typical range of CoV for company projects is 0.7 to 1.0, then would this project be considered more or less riskly? IV. NPV Break-even Makes NPV = 0 Use Goal Seek (in Data - What if Analysis) Variable Price Machine Cost #units ra Key Output: NPV = $ 100.05 Goal Seek SE$17 d = CCA rate= Machine Costa Shipping Cost = Installation cost = Change in NOWC = # Units = Price = Costs = Inflation = Salvage Value = Economic life = 11% 26% 20% 200,000 10,000 30,000 32,000 1,250 200 100 3% 25,000 4.00 Set cell: To value By changing cell D OK $B$23 Cancel years
Step by Step Solution
There are 3 Steps involved in it

Get step-by-step solutions from verified subject matter experts