

Question: http://mba.tuck.dartmouth.edu/pages/faculty/ken.french/data_library.html Please help! The excel spreadsheet needed is given below. Part 1. Univariate Statistics. Please go to Professor Kenneth French's data library website and obtained
http://mba.tuck.dartmouth.edu/pages/faculty/ken.french/data_library.html
Please help! The excel spreadsheet needed is given below.
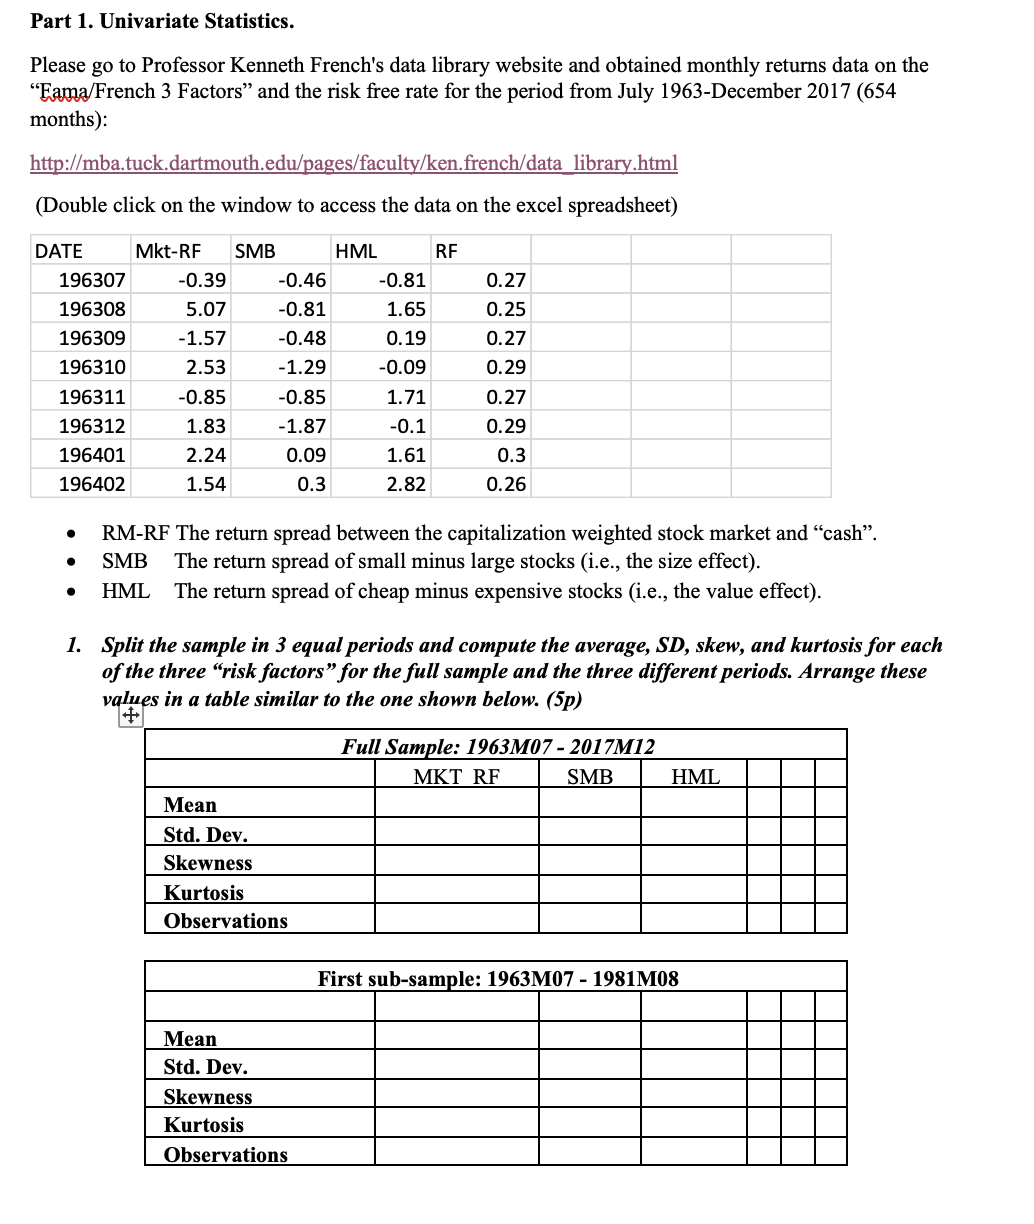
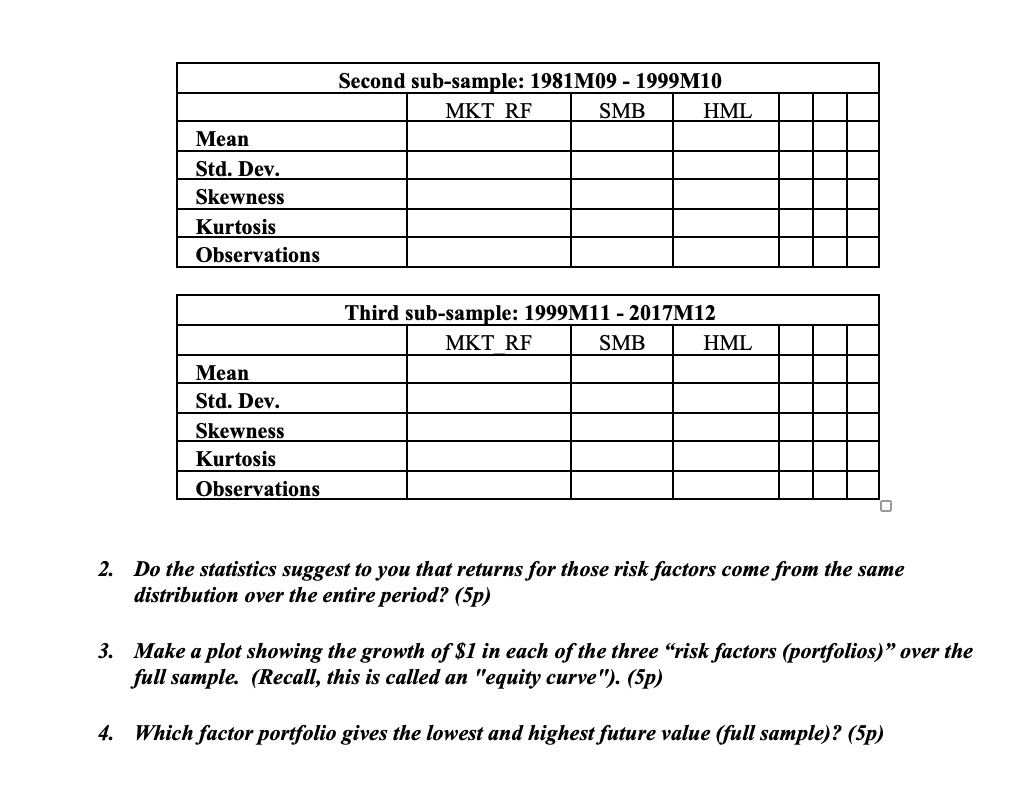
Part 1. Univariate Statistics. Please go to Professor Kenneth French's data library website and obtained monthly returns data on the "Fama/French 3 Factors" and the risk free rate for the period from July 1963-December 2017 (654 months): http://mba.tuck.dartmouth.edu/pages/faculty/ken.french/data_library.html (Double click on the window to access the data on the excel spreadsheet) DATE Mkt-RF SMB HML RF 196307 -0.39 0.46 -0.81 0.27 196308 5.07 -0.81 1.65 0.25 196309 -1.57 -0.48 0.19 0.27 196310 2.53 -1.29 -0.09 0.29 196311 -0.85 -0.85 1.71 0.27 196312 1.83 -1.87 0.1 0.29 196401 2.24 0.09 1.61 0.3 196402 1.54 0.3 2.82 0.26 RM-RF The return spread between the capitalization weighted stock market and "cash". . SMB The return spread of small minus large stocks (i.e., the size effect). . HML The return spread of cheap minus expensive stocks (i.e., the value effect). 1. Split the sample in 3 equal periods and compute the average, SD, skew, and kurtosis for each of the three "risk factors" for the full sample and the three different periods. Arrange these values in a table similar to the one shown below. (5p) Full Sample: 1963M07 - 2017M12 MKT RF SMB HML Mean Std. Dev. Skewness Kurtosis Observations First sub-sample: 1963M07 - 1981M08 Mean Std. Dev. Skewness Kurtosis ObservationsSecond sub-samle: 1981M09 - 1999M10 Std. Dev. 2. Do the statistics suggest to you that returns for those risk factors come from the same distribution over the entire period? (5p) 3. Make a plot showing the growth of$1 in each of the three \"risk factors (portfolios) \" over the full sample (Recall, this is called an "equity curve '9. (5p) 4. Which factor portfolio gives the lowest and highest future value (full sample)? (5p)
Step by Step Solution
There are 3 Steps involved in it

Get step-by-step solutions from verified subject matter experts