

Question: https://docs.google.com/spreadsheets/d/1y3LRrlEQwOnCwC-3IOuJ3QTjFRY_8P4IbRoIyHqYZEI/template/preview ^^^^^^^^^^THIS LINK ABOVE CAN HELP / ITS A GOOGLE SHEET http://www.mathandstatistics.com/learn-stats/confidence-intervals/confidence-intervals-for-means the answer is in a tri- linear , using DECIMALS this is what
https://docs.google.com/spreadsheets/d/1y3LRrlEQwOnCwC-3IOuJ3QTjFRY_8P4IbRoIyHqYZEI/template/preview
^^^^^^^^^^THIS LINK ABOVE CAN HELP / ITS A GOOGLE SHEET
http://www.mathandstatistics.com/learn-stats/confidence-intervals/confidence-intervals-for-means
the answer is in a tri- linear , using DECIMALS
this is what i got the last time:
Explanation:
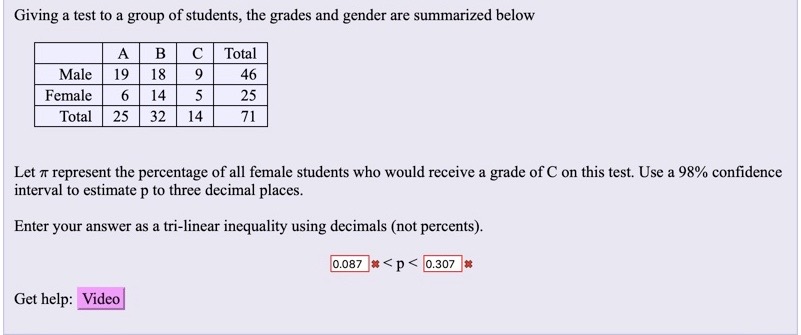
percentage of females with c grade, p= ?255?? *100 = 20%
standard deviation =?Np(1?p)??? = ?250.2(1?0.2)??? = 0.08 or 8%
for 98% z score = 2.326
hence range = ( 20% + 2.326 * 8% , 20% + 2.326 * 8% )
= (1.392% , 38.608%)
or ( 0.01392 , 0.386 )
or 0.01392
AS YOU CAN SEE , its only partially correct .
\f
Step by Step Solution
There are 3 Steps involved in it

Get step-by-step solutions from verified subject matter experts