

Question: https://drive.google.com/file/d/1Ffac4mVQLBLmru4Anc7fP43Ji9GYU8pM/view?usp=drivesdk Name: Course and Section: Problem: The following data show the customer's ages in a new open supermarket. Construct a frequency distribution table and find
https://drive.google.com/file/d/1Ffac4mVQLBLmru4Anc7fP43Ji9GYU8pM/view?usp=drivesdk
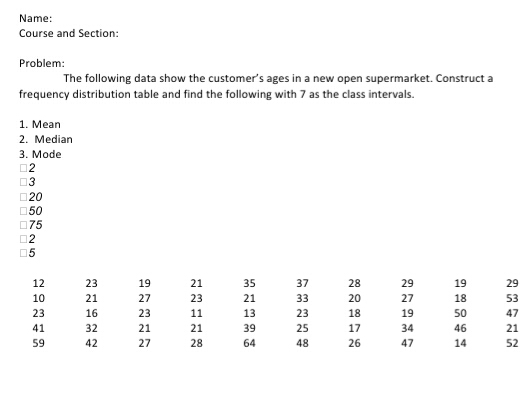
Name: Course and Section: Problem: The following data show the customer's ages in a new open supermarket. Construct a frequency distribution table and find the following with 7 as the class intervals. 1. Mean 2. Median 3. Mode 02 03 020 050 075 02 05 12 23 19 21 35 37 28 29 19 29 10 21 27 23 21 33 20 27 18 53 23 16 23 11 13 23 18 19 50 47 41 32 21 21 39 25 17 34 46 21 59 42 27 28 64 48 26 47 14 52
Step by Step Solution
There are 3 Steps involved in it
1 Expert Approved Answer
Step: 1 Unlock

Question Has Been Solved by an Expert!
Get step-by-step solutions from verified subject matter experts
Step: 2 Unlock
Step: 3 Unlock