

Question: ( https://fred.stlouisfed.org/ ) QUESTION 1 How has the trade balance (net exports, X-M) in the United States changed over time? Use the US net exports
(https://fred.stlouisfed.org/)
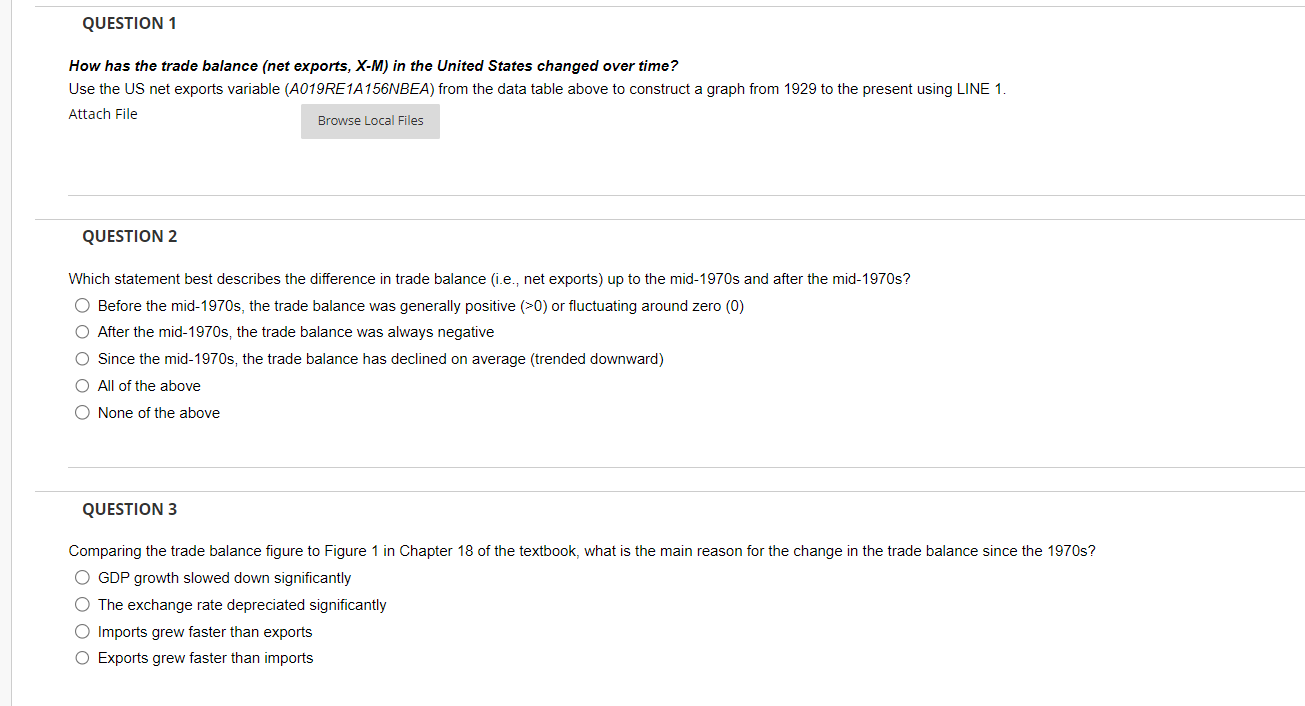
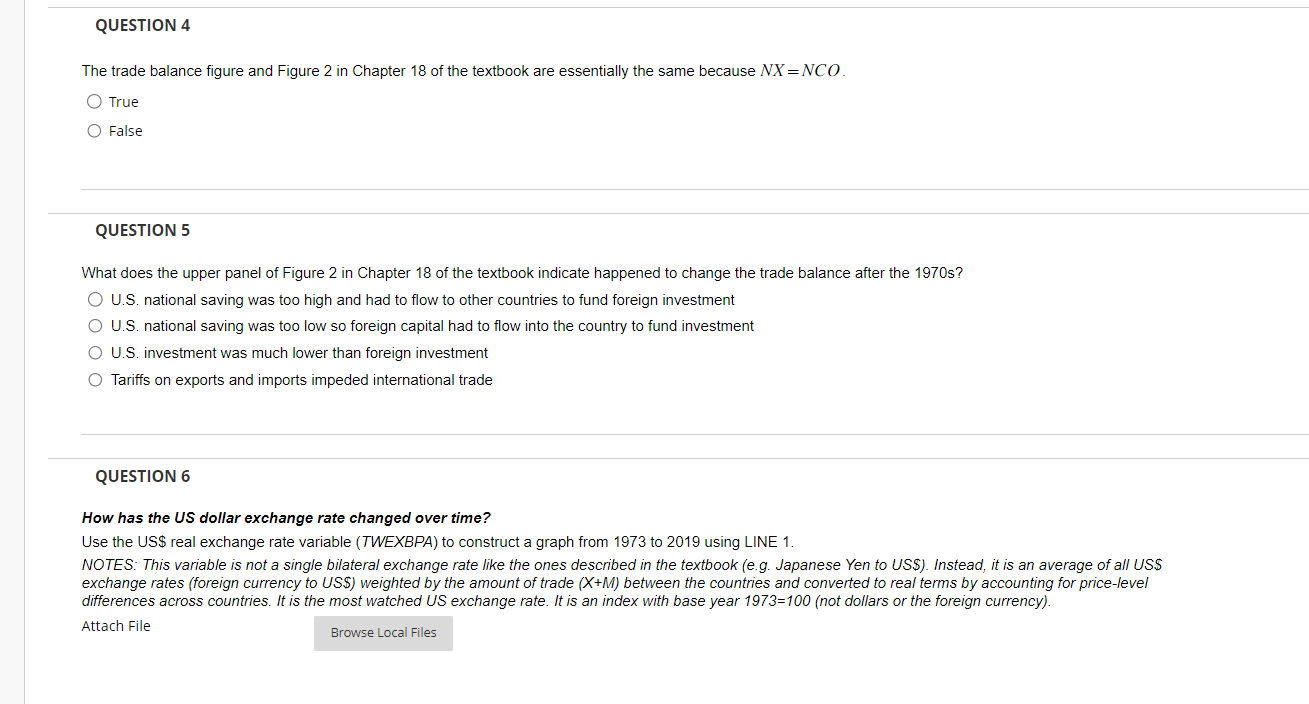
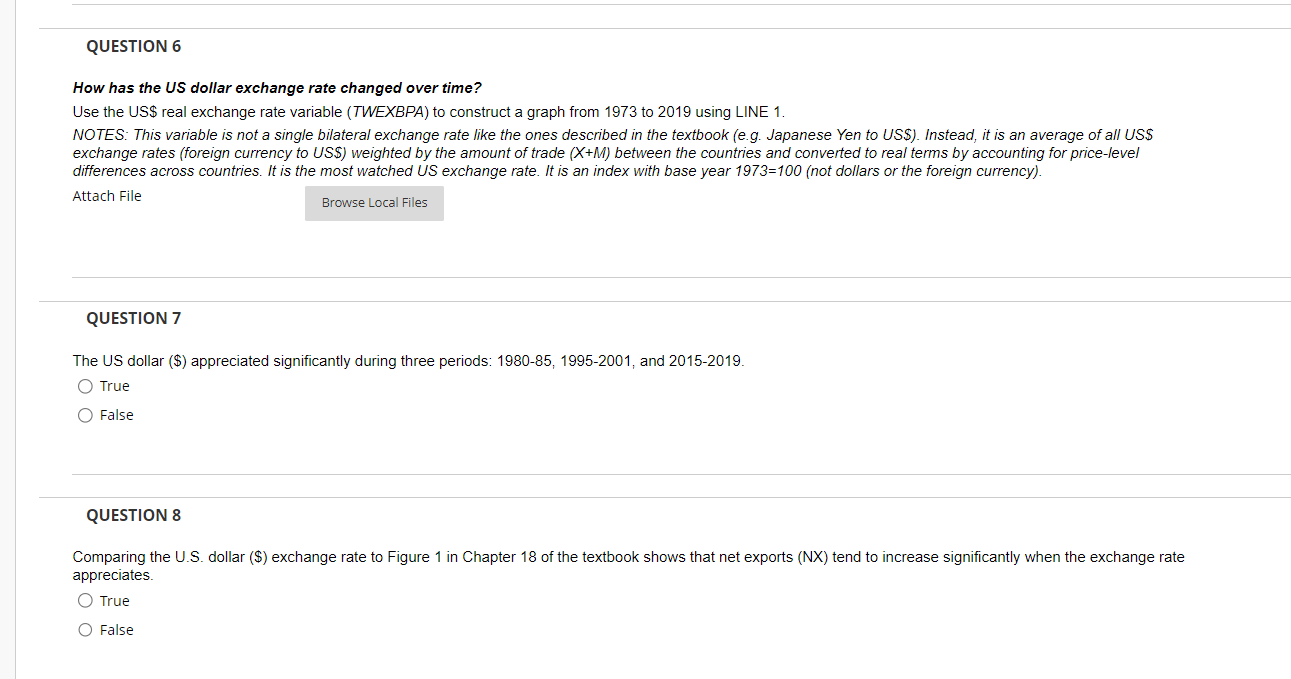
QUESTION 1 How has the trade balance (net exports, X-M) in the United States changed over time? Use the US net exports variable (A019RE1A156NBEA) from the data table above to construct a graph from 1929 to the present using LINE 1. Attach File Browse Local Files QUESTION 2 Which statement best describes the difference in trade balance (i.e., net exports) up to the mid-1970s and after the mid-1970s? Before the mid-1970s, the trade balance was generally positive (>0) or fluctuating around zero (0) After the mid-1970s, the trade balance was always negative O Since the mid-1970s, the trade balance has declined on average (trended downward) O All of the above O None of the above QUESTION 3 Comparing the trade balance figure to Figure 1 in Chapter 18 of the textbook, what is the main reason for the change in the trade balance since the 1970s? O GDP growth slowed down significantly The exchange rate depreciated significantly O Imports grew faster than exports O Exports grew faster than importsQUESTION 4 The trade balance figure and Figure 2 in Chapter 18 of the textbook are essentially the same because NX = NCO. O True O False QUESTION 5 What does the upper panel of Figure 2 in Chapter 18 of the textbook indicate happened to change the trade balance after the 1970s? O U.S. national saving was too high and had to flow to other countries to fund foreign investment O U.S. national saving was too low so foreign capital had to flow into the country to fund investment O U.S. investment was much lower than foreign investment O Tariffs on exports and imports impeded international trade QUESTION 6 How has the US dollar exchange rate changed over time? Use the US$ real exchange rate variable (TWEXBPA) to construct a graph from 1973 to 2019 using LINE 1. NOTES: This variable is not a single bilateral exchange rate like the ones described in the textbook (e.g. Japanese Yen to US$). Instead, it is an average of all US$ exchange rates (foreign currency to US$) weighted by the amount of trade (X+M) between the countries and converted to real terms by accounting for price-level differences across countries. It is the most watched US exchange rate. It is an index with base year 1973=100 (not dollars or the foreign currency). Attach File Browse Local FilesQUESTION 6 How has the US dollar exchange rate changed over time? Use the US$ real exchange rate variable (TWEXBPA) to construct a graph from 1973 to 2019 using LINE 1. NOTES: This variable is not a single bilateral exchange rate like the ones described in the textbook (e.g. Japanese Yen to US$). Instead, it is an average of all US$ exchange rates (foreign currency to US$) weighted by the amount of trade (X+M) between the countries and converted to real terms by accounting for price-level differences across countries. It is the most watched US exchange rate. It is an index with base year 1973=100 (not dollars or the foreign currency). Attach File Browse Local Files QUESTION 7 The US dollar ($) appreciated significantly during three periods: 1980-85, 1995-2001, and 2015-2019. O True O False QUESTION 8 Comparing the U.S. dollar ($) exchange rate to Figure 1 in Chapter 18 of the textbook shows that net exports (NX) tend to increase significantly when the exchange rate appreciates. O True O False
Step by Step Solution
There are 3 Steps involved in it

Get step-by-step solutions from verified subject matter experts