

Question: https://phet.colorado.edu/en/simulations/circuit-construction-kit-dc - Make a section in your document with the heading OBSERVATIONS AND ANALYSIS (for all your gathered data, calculations and images ofgraphs. etc.). Then
https://phet.colorado.edu/en/simulations/circuit-construction-kit-dc
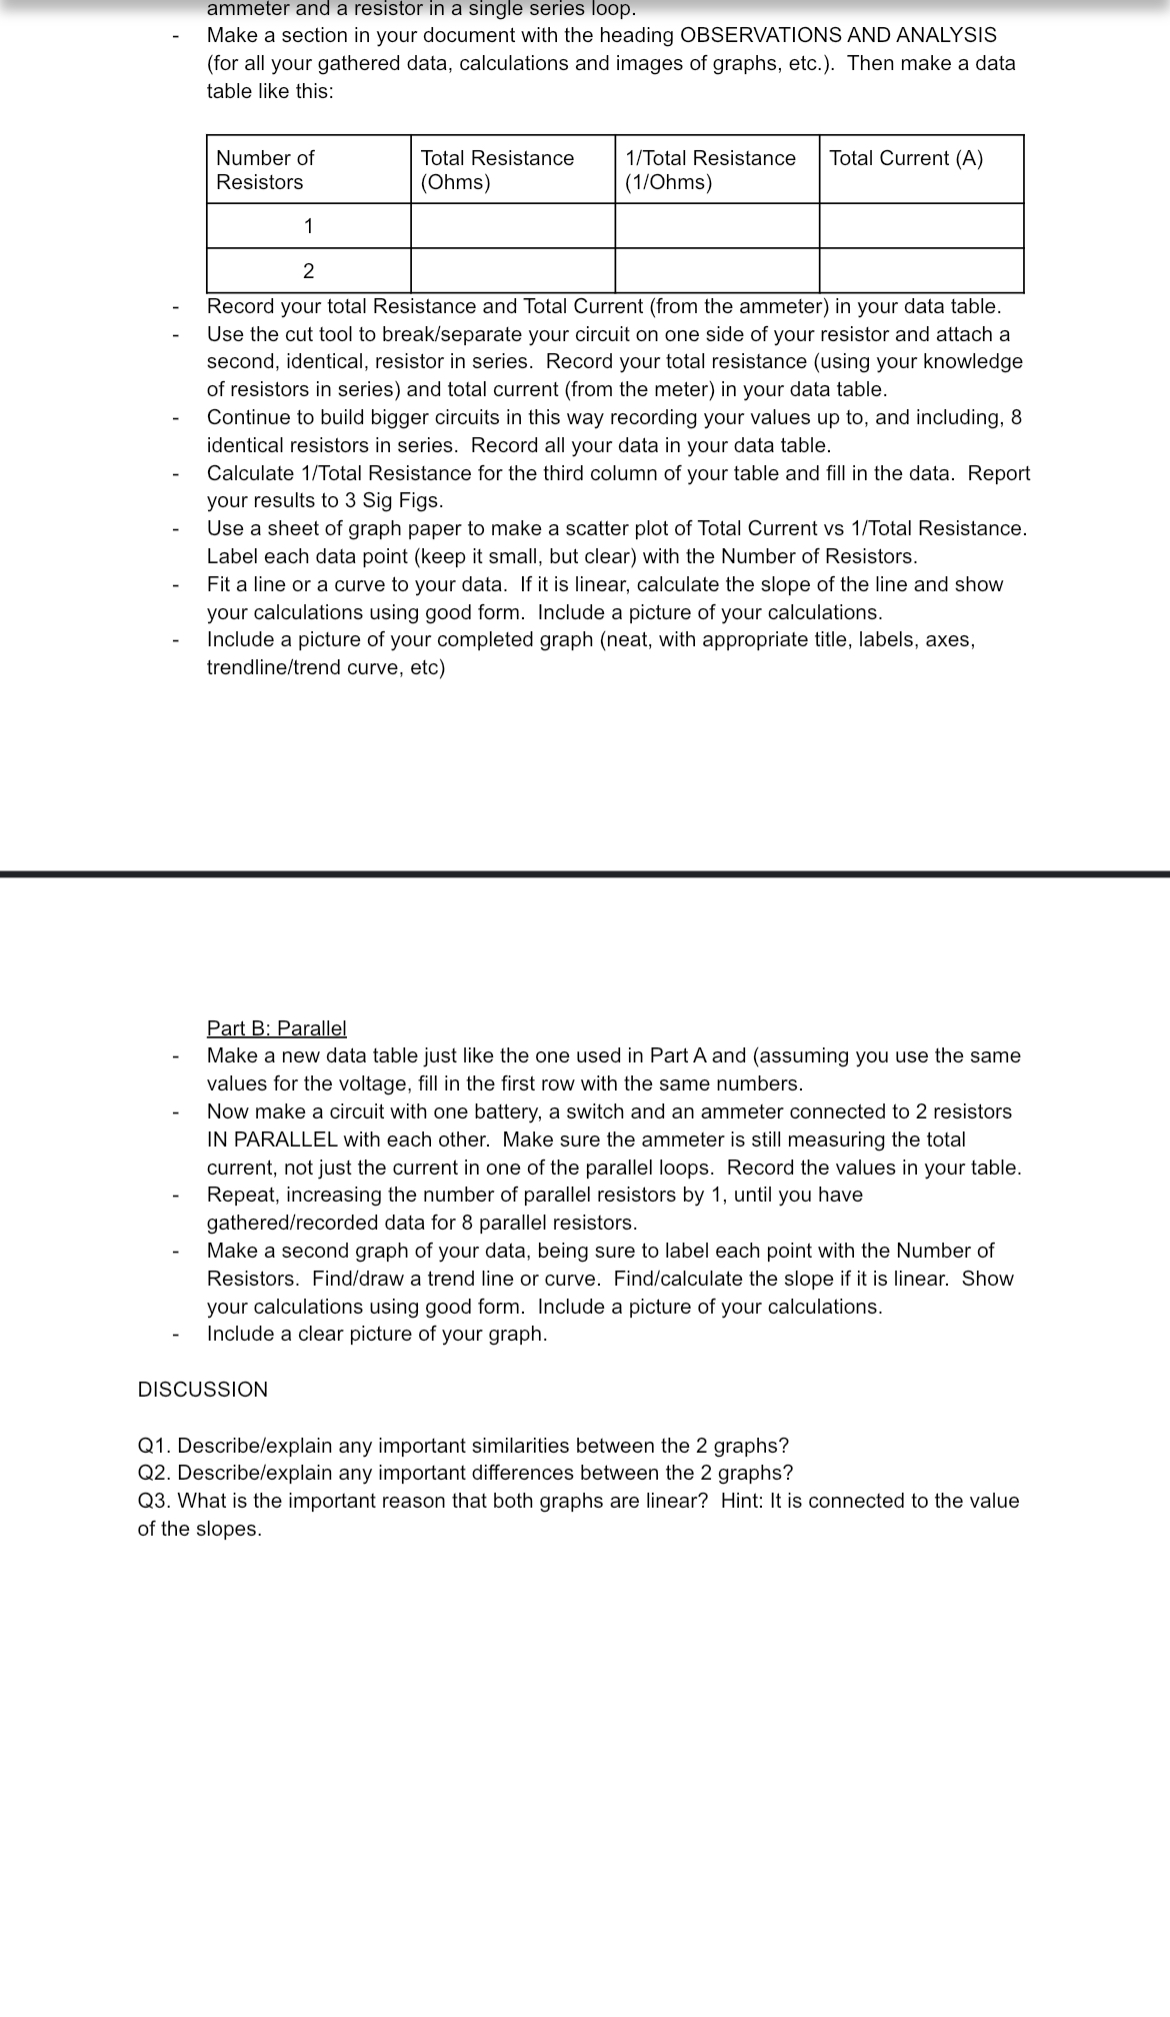
- Make a section in your document with the heading OBSERVATIONS AND ANALYSIS (for all your gathered data, calculations and images ofgraphs. etc.). Then make a data table like this: Number of Total Resistance 1/Total Resistance Total Current (A) Resistors (Ohms) (1l0hms) - Record your total Resistance and Total Current (from the ammeter) in your data table. - Use the cut tool to break/separate your circuit on one side of your resistor and attach a second, identical, resistor in series. Record your total resistance (using your knowledge of resistors in series) and total current (from the meter) in your data table. - Continue to build bigger circuits in this way recording your values up to, and including. 8 identical resistors in series. Record all your data in your data table. - Calculate 1fTotaI Resistance for the third column of your table and ll in the data. Report your results to 3 Sig Figs. - Use a sheet of graph paper to make a scatter plot of Total Current vs ilTotaI Resistance. Label each data point (keep it small. but clear) with the Number of Resistors. - Fit a line or a curve to your data. If it is linear. calculate the slope of the line and show your calculations using good form. Include a picture of your calculations. - Include a picture of your completed graph (neat. with appropriate title. labels. axes. trendlineltrend curve. etc) EajLEaLallel - Make a new data table just like the one used in PartAand (assuming you use the same values for the voltage. ll in the rst row with the same numbers. - Now make a circuit with one battery. a switch and an ammeter connected to 2 resistors IN PARALLEL with each other. Make sure the ammeter is still measuring the total current. notjust the current in one of the parallel loops. Record the values in your table. - Repeat, increasing the number of parallel resistors by 1. until you have gathered/recorded data for 8 parallel resistors. - Make a second graph of your data. being sure to label each point with the Number of Resistors. Findfdraw a trend line or curve. Findicalculate the slope if it is linear. Show your calculations using good form. Include a picture of your calculations. Include a clear picture of your graph. DISCUSSION 01. Describe/explain any important similarities between the 2 graphs? 02. Describe/explain any important differences between the 2 graphs? Q3. What is the important reason that both graphs are linear? Hint: It is connected to the value of the slopes
Step by Step Solution
There are 3 Steps involved in it

Get step-by-step solutions from verified subject matter experts