

Question: Bandlimited Random Processes Plot the power spectral density of the amplitude modulated signal Y() in Example, assuming fc > W; fc < W. Assume
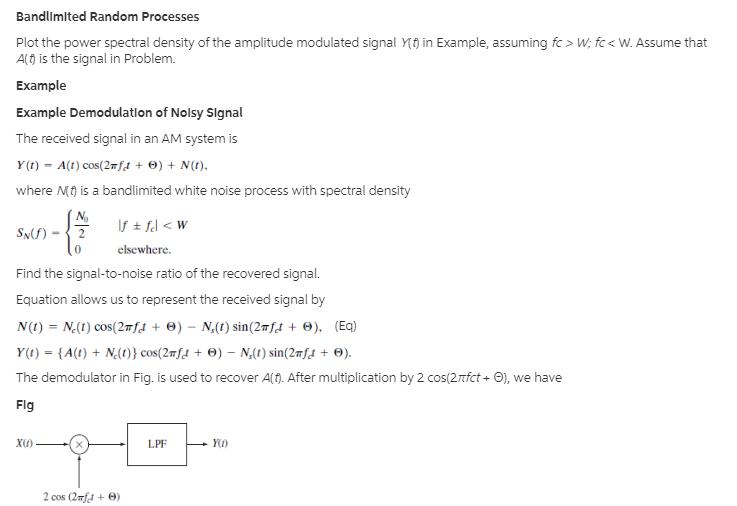
Bandlimited Random Processes Plot the power spectral density of the amplitude modulated signal Y() in Example, assuming fc > W; fc < W. Assume that A() is the signal in Problem. Example Example Demodulation of Noisy Signal The received signal in an AM system is Y(t) = A(t) cos(2mft + 0) + N(1), where M(t) is a bandlimited white noise process with spectral density No 2 SN(f) If fcl 2Y (1) cos(2mf1 + 0) = (A(1) + N(1)}2 cos (2mf1 + 0) - N,(t)2 cos(2#f1 + 0) sin(2af1 + 0) - {A(1) + N(1)} (1 + cos(4mf1 +20)) - N(1) sin(4mf + 20). After lowpass filtering, the recovered signal is A(t) + Ne(t). The power in the signal and noise components, respectively, are - [SA(f) af -W No PN. - [SN,(f) df = [(+2) df. -W The output signal-to-noise ratio is then SNR df = 2W No- 2W No (b) Find Rz(1) and SZ). Problem (b) Find the autocorrelation corresponding to the power spectral density Sx(f) = g(f/w).
Step by Step Solution
3.47 Rating (160 Votes )
There are 3 Steps involved in it

Get step-by-step solutions from verified subject matter experts