Question: https://www.irs.gov/pub/irs-pdf/p1304.pdf#page=22 for reference use this link page 215-218 . a Chapter 13, End of Chapter, Research Problems, Exercise 3 Page 1343 p 3 it Which
https://www.irs.gov/pub/irs-pdf/p1304.pdf#page=22 for reference use this link page 215-218
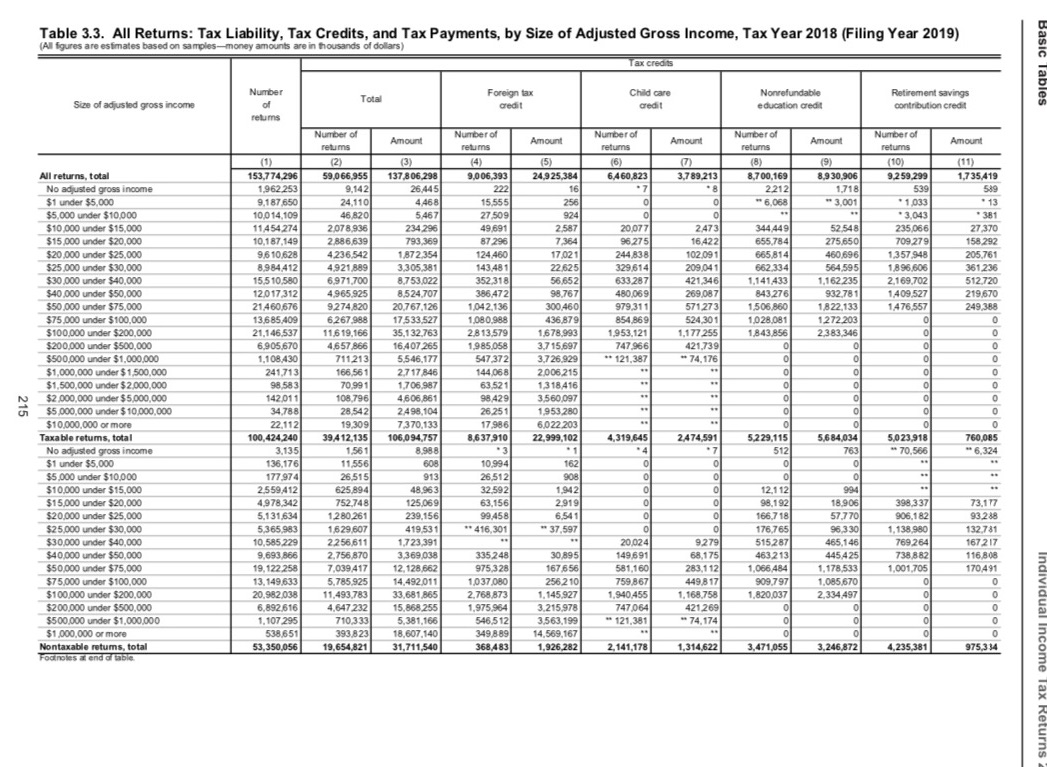
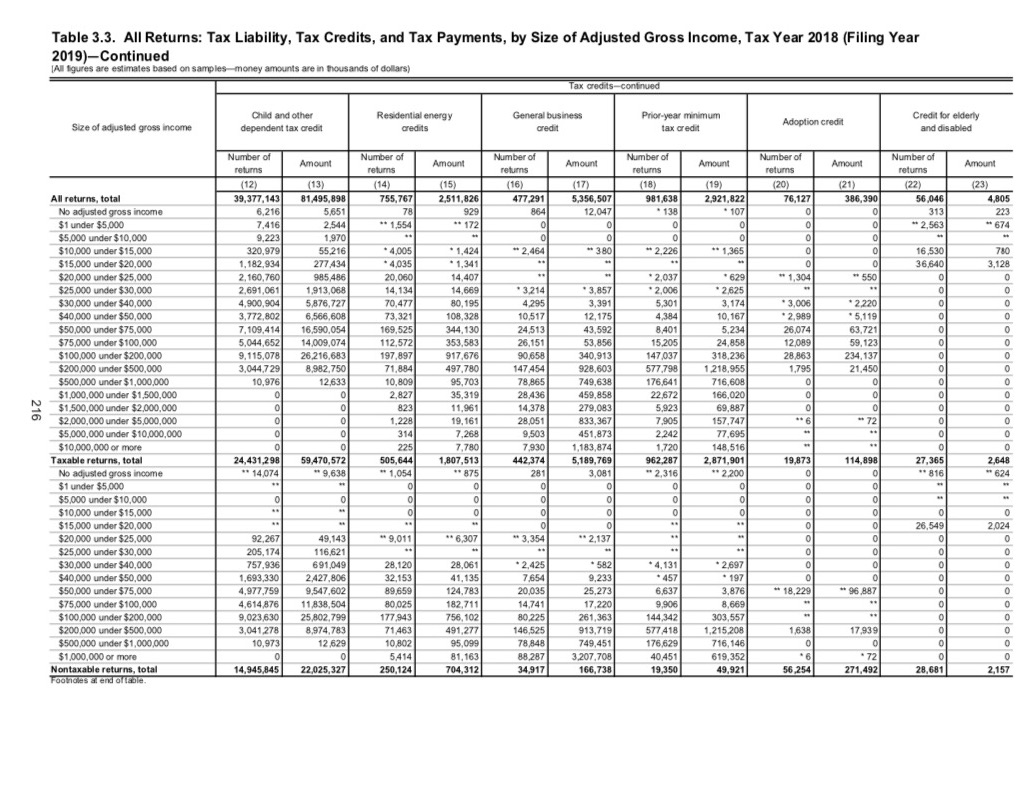
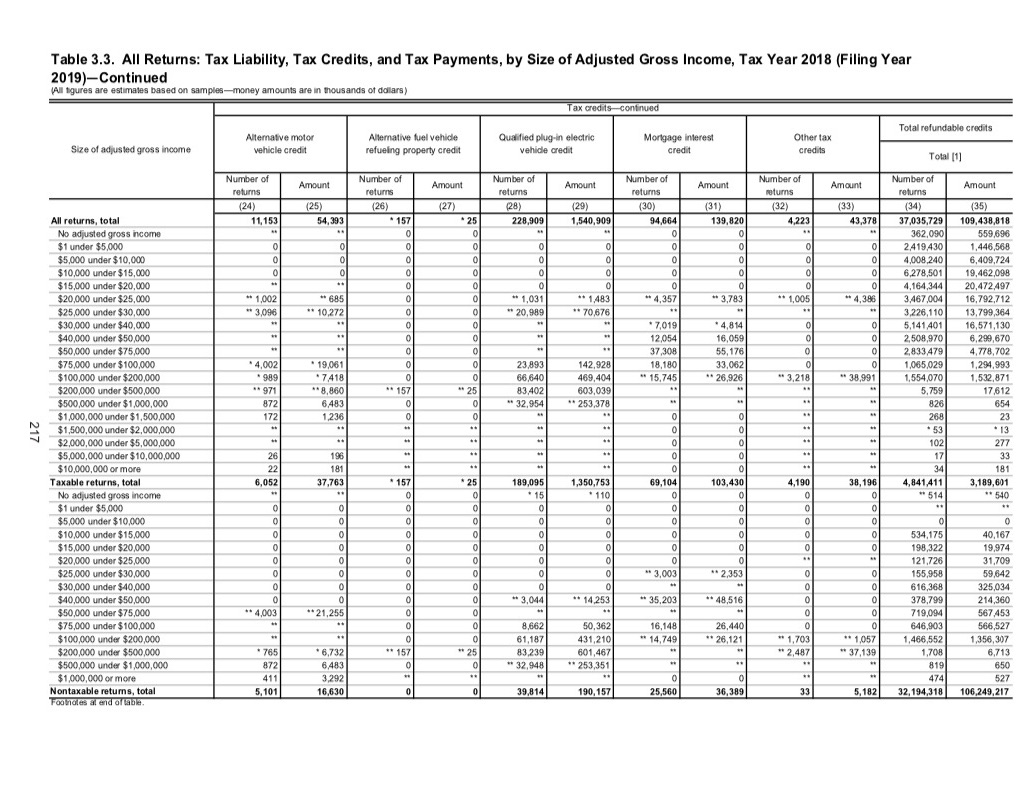
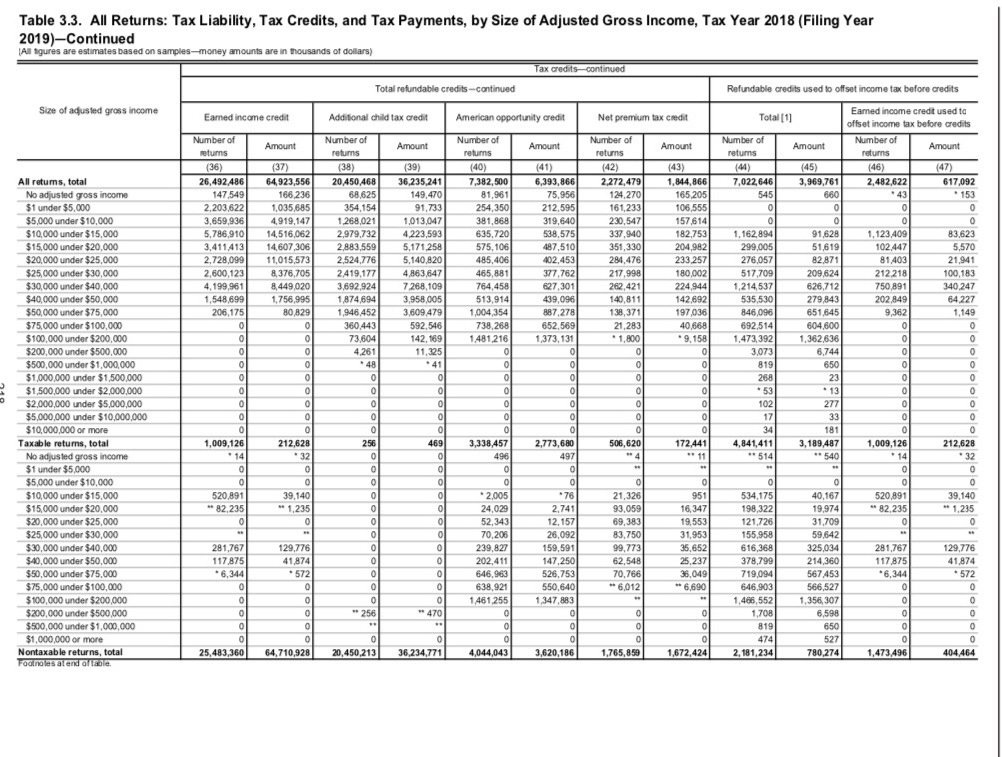
. a Chapter 13, End of Chapter, Research Problems, Exercise 3 Page 1343 p \"3 it Which tax credits are most often claimed by individual taxpayers? Do the credits claimed vary by size of income (AGI)? To answer these questions, go to the IRS Tax Statistics page (irsgov/statistics) and download the Microsoft Excel spreadsheet that documents tax liability, tax credits, and tax payments. You can find this in the Individual lncome Tax Return (Form 1040) Statistics section of the site; click on the "by Size of Adjusted Gross Income" link. Evaluate the credits claimed (both nonrefundable and refundable) by size of AGI. Analyze the data by clustering it into the following AG] classes: $25,000 or less; $25,000 to $50,000; $50,000 to $100,000; $100,000 to $500,000; $500,000 or more. Present your ndings in a visual (e.g., bar chart), summarize your findings in a onepage memo, and send your spreadsheet and memo to your instructor. Table 3.3. All Returns: Tax Liability, Tax Credits, and Tax Payments, by Size of Adjusted Gross Income, Tax Year 2018 (Filing Year 2019) (All figures are estimates based on samples-money amounts are in thousands of dollars) Tax credits Number Foreign tax Child care Size of adjusted gross income Nonrefundable of Total Retirement savings credit credit retums education credit contribution credit Number of Amount Number of returns Amount Number of Amount Number of retums return returns Amount Number of returns Amount (1) (2) (3) (4) (5) (6) (7) (8) (9) (10) All returns, total (11) 53,774.296 59.066.955 137.806.298 9.0 06.393 24,925.384 6,460,823 3,789.213 8,700,169 8,930.906 No adjusted gross income 9.259.299 1,962.253 1,735,419 9.142 26.445 222 2.212 1,718 539 $1 under $5,000 539 9.187.650 24,110 468 15.555 *6,068 *3,001 1.033 * 13 $5,000 under $10,000 10.014,109 46,820 5467 27.509 924 $10,000 under $15,000 * 3,043 . 381 11 454.274 2.078.936 234.296 49.691 2.587 20.07 7 473 344.449 $15,000 under $20,000 52.548 235,066 10,187.149 27 370 2.886,639 793,369 87 296 7.364 96.27 5 16422 655,784 275.650 $20,000 under $25,000 709.279 158,292 9.6 10628 4.236.542 1872.354 124 460 17.02 1 244.838 102.09 1 665.814 $25,000 under $30.000 460.69 8,984.412 1357.948 205,761 4.921.889 3.305,381 143,481 22 625 329.614 209 041 662.334 $30,000 under $40,000 564.595 15.5 10,580 1.896.606 361236 6,971,700 8.753.022 352.318 56.652 633.287 421,346 1.141,433 $40,000 under $50,000 .162.235 2.169.702 12017.312 512.720 4,965.925 8,524.707 386,472 98.767 480.069 269.087 843,276 932.781 $50,000 under $75,000 1,409.527 21460.676 219.670 9.274.820 20.767.126 1.042.136 300.460 979.31 1 $71273 1.506.860 $75.000 under $100,000 13.685,409 1,822.133 1 476.557 6.267.988 249.368 17.533,527 1.080.988 436.879 854.869 524.301 1.028.081 $100.000 under $200,000 21,146.537 1.272.203 11.6 19,166 35,132.763 2.813.579 1.678.993 1.953.121 1,177.255 0 1,843.856 2,383.346 $200.000 under $500,000 6.905.670 4.657 866 1.985.058 0 16,407 .265 3.7 15.697 747.966 421.739 $500.000 under $1,000,000 0 1,108,430 711213 5.546.177 547.372 3.726.929 "* 121,387 "74.176 $1,000,000 under $1,500,000 241,713 0 166,561 2.717 846 144,068 2.006.215 $1,500,000 under $2.000,000 98.583 70.99 1,706.987 63,521 1318416 $2,000,000 under $5,000,000 142.01 1 108,796 4.606,861 98,429 3.560.097 $5,000,000 under $ 10,000,000 34,788 28,542 2498,104 26,25 1,953.280 $10,000,000 or more 0 22.112 19.309 7 370.133 17.986 6,022.203 0 Taxable returns, total 100,424,240 39,4 12,135 106,094,757 8,637,910 22,999,102 4,319.645 2474,591 5,229,115 5,684,034 No adjusted gross income 5,023,918 760,085 3,135 1,561 8.98 8 * 3 .4 * 7 512 763 $1 under $5,000 " 70.566 -6,324 136,176 11,55 608 10.994 162 0 $5,000 under $10,000 177.974 26.515 913 26.512 908 o O $10.000 under $15,000 2.559,412 625,894 48.963 12.592 1.942 994 $15,000 under $20,000 12,1 12 4,978.342 752.748 125.069 63,156 2919 0 98,192 $20.000 under $25,000 18,906 398,337 73.177 5.131,634 1,280.261 239.156 99.458 6.541 166,7 18 $25,000 under $30,000 57.770 906,182 93.288 5,365,983 1,629.607 419.531 *416,301 "37.597 176,765 $30.000 under $40,000 96,3 30 1,138,980 132.731 10.585,229 2.256,611 1,723,391 01024 9.279 $40,000 under $50,000 515,287 465,146 769.264 9,693,866 167 217 2.756,870 3,369,038 335.248 30,895 149.691 68,17 $50,000 under $75,000 463.213 445,425 738 8 82 19, 122,258 116,808 7,039 417 12,128,662 975,328 167 656 581,160 283,1 12 1.066,484 1,178,533 $75,000 under $100,000 1.001 705 170.491 13.149.633 5.785.925 14.492 011 1,037.080 256.2 10 759.867 449.8 17 $100,000 under $200,000 909.797 1.085,670 20.982,038 11.493,783 33,681,865 2.768,873 1.145.927 1.940.455 . 168.758 1,820.037 $200.000 under $500,000 2.334.497 6,892.616 0 4.647 232 15.868.255 1.975.964 3.215.978 747.064 421.269 $500,000 under $1,000,000 0 1. 107 295 710.333 5.381.166 546.512 3,563,199 " 121,381 "74.174 $1,000.000 or more 538.651 393.823 18.607.140 349.8-89 14.569.167 Nontaxable returns, total 53,350,056 19.654,821 31,711.540 368,483 1,926.282 Footnotes at end of table. 2,141,178 1,314,622 3,471,055 3,246,872 4.235,381 975.3 34Table 3.3. All Returns: Tax Liability, Tax Credits, and Tax Payments, by Size of Adjusted Gross Income, Tax Year 2018 (Filing Year 2019)-Continued [All figures are estimates based on samples-money amounts are in thousands of dollars) Tax credits-continued Child and other Residential energy General business Prior-year minimum Size of adjusted gross income dependent tax credit credits credit tax credit Adoption credit Credit for elderly and disabled Number of Amount Number of Amount Number of Number of Number of Number of returns return returns Amount returns Amount returns Amount returns Amount (12) (13) (14) (15) 16) (17) (18) (19) (20) (21) (22) (23) All returns, total 39,377,143 81,495,898 755,767 2.511,826 477,291 5,356,507 981,638 2,921,822 76,127 386,390 56,046 4.805 No adjusted gross income 6,216 5,651 78 929 864 12,047 . 138 107 $1 under $5,000 313 223 7,416 2,544 "* 1.554 "* 172 $5,000 under $10,000 " 2,563 674 9.223 1.970 $10.000 under $15,000 0 320,979 55.216 * 4.005 * 1,424 " 2.464 # 380 * 2,226 * 1,365 16.530 $15,000 under $20,000 780 , 182,934 277.434 * 4.035 * 1,341 36,640 $20,000 under $25,000 2, 160,760 3,128 985,486 20,060 14,407 * 2.037 629 "1,304 " 550 $25,000 under $30,000 2,691,061 1,913,068 4,134 14,669 * 3.214 * 3,857 2,006 2 625 $30,000 under $40,000 4,900,904 0 5,876,727 70,477 80, 195 4,295 3,391 5,301 3,174 3,006 $40,000 under $50,000 3,772,802 2,220 6,566,608 73,321 108,328 10.517 12,175 4.384 10,167 2,989 * 5,119 $50,000 under $75,000 7. 109,414 16,590,054 169,525 344. 130 4.513 43,592 8,401 5.234 26,074 $75,000 under $100,000 5.044.652 63.721 14,009.074 112,572 353,583 26,151 $3,856 15,205 24,858 12,089 59. 123 $100,000 under $200,000 9.115,078 26,216,683 197.897 917.676 10.658 340,913 147037 318,236 $200,000 under $500,000 28,863 234,137 3,044.729 8,982,750 71.894 497.780 147 454 928,603 577,798 1218.955 1.795 21,450 $500.000 under $1,000,000 10,976 12,63 10,809 95,703 78.865 749,638 176.641 716,608 $1,000,000 under $1,500,000 2.827 35,319 N 28.436 459.858 22 672 166,020 $1,500,000 under $2,000,000 823 11,961 14.378 279,083 5.923 69.887 $2000,000 under $5,000,000 1.228 19, 161 28,051 833.367 7,905 57.747 $5,000,000 under $10,000,000 72 314 7.268 9.503 451,873 2.242 77.69 $10,000,000 or more 225 7,780 7.930 1,183,874 1,720 148,516 Taxable returns, total 24,431,298 59,470,572 505,644 1,807,513 442,374 5,189,769 962,287 2,871,901 "14,074 19,873 No adjusted gross income 114,898 "9,638 27,365 " 1.054 . 875 281 3,081 " 2,316 *2,200 ". 816 $1 under $5,000 " 624 0 $5,000 under $10,000 $10,000 under $15,000 $15,000 under $20,000 0 $20,000 under $25,000 26,549 92,26 49.14 # 9,011 "6.307 " 3,354 *2,137 $25,000 under $30,000 205, 174 116,62 $30.000 under $40,000 757,936 691,045 28,120 28,061 2,425 582 * 4.131 2.697 $40.000 under $50,000 1.693,330 2 427,806 32.15 41,135 7.654 9.233 * 457 * 197 0 $50.000 under $75,000 4,977.759 9.547.602 89.659 124,783 20.035 25,273 6.637 3,876 # 18,229 # 96 887 $75,000 under $100,000 4,614 876 11,838,504 80,025 182,711 14,741 17,220 9.906 8,669 $100,000 under $200,000 9.023,630 25,802,799 177,943 756, 102 30.225 261,363 144,342 303,557 $200,000 under $500,000 3,041,278 8,974.783 71463 491,277 146,525 913,719 577 418 1,215,208 1.638 $500,000 under $1,000,000 17,939 10,973 12,62 10,802 95,099 8,848 749,451 176,629 716,146 $1,000.000 or more 5414 81, 163 18.287 3,207.708 40 451 619,352 Nontaxable returns, total 14,945,845 . 72 22025,327 250,124 704,312 14.917 166,738 Foolmales at end of table. 19,350 49.921 56,25 271,492 28,681 2,157Table 3.3. All Returns: Tax Liability, Tax Credits, and Tax Payments, by Size of Adjusted Gross Income, Tax Year 2018 (Filing Year 2019)-Continued (All figures are estimates based on samples-money amounts are in thousands of dollars) Tax credits-continued Alternative motor Alternative fuel vehicle Total refundable credits Qualified plug-in electric Mortgage interest Other tax Size of adjusted gross income vehicle credit refueling property credit vehicle credit credit credits Total [1] Number of Amount Number of Amount Number of Amount Number of Amount Number of Number of return returns return return returns Amount returns Amount (24) (25 (26) (27) (28) (29) (30) (31) (32] (33) (34) (35) All returns, total 11, 153 54.393 157 25 228,909 1,540,909 94,664 139,820 1,223 43,378 37,035,729 109,438,818 No adjusted gross income 362,090 559,696 $1 under $5,000 2419.430 1,446,568 $5,000 under $10,000 4,008,240 6,409,724 $10,000 under $15,000 6,278,501 19,462,098 $15,000 under $20,000 0 0 4,164,344 20,472,497 $20,000 under $25,000 * 1,002 # 685 #* 1,031 *# 1.483 #* 4.357 " 3,783 * 1,005 # 4,386 3,467,004 16,792,712 $25,000 under $30,000 *3.096 #* 10.272 # 20,989 #70.676 3,226,110 13,799,364 $30,000 under $40,000 * 7,019 * 4,814 5,141,401 16,571,130 $40,000 under $50,000 12.054 16,059 2,508,970 6,299,670 $50,000 under $75,000 37,308 $5,176 2,833,479 4,778,702 $75,000 under $100,000 * 4,002 19,061 23,893 142,928 18,180 13,062 1,065,029 1,294,993 $100,000 under $200,000 . 989 . 7418 66,640 469,404 " 15,745 "26,926 " 3,218 " 38,991 1,554,070 1,532,871 $200,000 under $500,000 *971 . 8,860 "*157 83,402 603,039 5,759 17.612 $500,000 under $1,000,000 872 6,483 "32.954 "253,378 826 654 $1,000,000 under $1,500,000 172 1.236 268 23 $1,500,000 under $2,000,000 * 53 * 13 $2,000,000 under $5,000,000 102 277 $5,000,000 under $10,000,000 26 196 17 33 $10,000,000 or more 22 181 181 Taxable returns, total 6,052 37,763 157 . 25 189,095 1,350,753 69,104 103,430 4,190 38, 196 4,841,411 3,189,601 No adjusted gross income * 15 * 110 "514 "510 $1 under $5,000 $5,000 under $10,000 0 $10,000 under $15,000 534.175 40.167 $15,000 under $20,000 goooooo 198,322 19.974 $20,000 under $25,000 121.726 31,709 $25,000 under $30,000 " 3,003 .* 2,353 155,958 59,642 $30,000 under $40,000 616,368 325,034 $40,000 under $50,000 " 3,044 *14.253 " 35,203 "* 48.516 378,799 214,360 $50,000 under $75,000 *4.003 * 21,255 719,094 567,453 $75,000 under $100,000 8,662 50,362 16,148 26,440 0 646,903 566,527 $100,000 under $200,000 61,187 431,210 " 14,749 "* 26,121 * 1,703 " 1.057 1,466,552 1,356,307 $200,000 under $500,000 765 * 6,732 "* 157 83,23 601,467 * 2,487 * 37.139 1,708 6,713 $500,000 under $1,000,000 872 6,483 # 32,948 253,351 819 650 $1,000,000 or more 411 3.292 474 Nontaxable returns, total 5,101 16,630 el 39,814 190, 157 25,560 36,38 33 5,182 Foolholes al end of table. 32, 194,318 106,249,217Table 3.3. All Returns: Tax Liability, Tax Credits, and Tax Payments, by Size of Adjusted Gross Income, Tax Year 2018 (Filing Year 2019)-Continued (All figures are estimates based on samples-money amounts are in thousands of dollars) Tax credits-continued Total refundable credits-continued Refundable credits used to offset income tax before credits Size of adjusted gross income Earned income credit Additional child tax credit American opportunity credit Net premium tax credit Total [1] Earned income credit used to offset income tax before credits Number of Amount Number of Number of Amount Number of Amount Number of Number of returns returns Amount returns returns returns Amount returns Amount (36) (37) (38) (39) (40) (41) (42) (43 (41) (45 (46) (47) All returns, total 26,492,486 64,923,556 20,450,468 36,235,241 7,382,500 6,393,866 2,272,479 1.844,866 7,022,646 3,969,761 147.549 2,482,622 617,092 No adjusted gross income 166,236 68,625 149,470 81,96 75,956 124,270 165,205 545 360 * 43 * 153 $1 under $5,000 2.203,622 1,035,685 354.154 91.733 254.350 212.595 161,233 106,555 $5,000 under $10,000 3,659,936 4,919,147 268,021 1,013,047 381,868 319.640 230,547 157.614 0 $10,000 under $15,000 5,786,910 14,516,062 2,979,732 4,223,593 635,720 538,575 337.940 182,753 1, 162,894 91.628 $15,000 under $20,000 1,123,409 83.623 3,411.413 14,607,306 2,883,559 5,171,258 575,106 487.510 351,330 204,982 299,005 $20,000 under $25,000 51,619 102.447 2,728,099 5.570 1 1,015,573 2,524,776 5,140,820 485,406 102,453 284,476 233,257 276,057 82.871 $25,000 under $30,000 2,600,123 31,403 21,941 8,376,705 2419,177 4,863,647 465,881 377,762 217,998 180,002 517,709 209,624 $30,000 under $40,000 4,199,961 212.218 100,183 8,449,020 3,692,924 7 268,109 764,458 827,301 262,421 $40,000 under $50,000 224,944 ,214,537 626,712 1,548,699 750,891 340.247 1,756,995 874.694 3,958,005 613,914 439,096 140,811 142,692 535,530 279,843 202,849 $50,000 under $75,000 206,175 80,829 1,946,452 64,227 3,609 479 1 004,354 887,278 138,371 197,036 846,096 651,645 $75,000 under $100,000 9,362 1,149 0 360,443 592,546 738,268 652,569 21.283 40,668 $100,000 under $200,000 692.514 604,600 73,60 0 142, 169 1,481,216 1,373,131 . 1,800 * 9.158 1.473,392 1.362,636 $200,000 under $500,000 4.261 0 11,325 0 o 3,073 6,74 $500,000 under $1,000,000 . 49 0 . 41 819 650 $1,000,000 under $1,500,000 268 $1,500,000 under $2,000,000 23 0 . 53 * 13 $2,000,000 under $5,000,000 0 102 277 0 $5,000,000 under $10,000,000 0 17 33 0 $10,000,000 or more al 34 181 Taxable returns, total 1,009,126 212,628 256 469 3,338,457 2,773,680 506,620 172.441 4,841,411 3,189,487 1,009,126 212.628 No adjusted gross income 14 - 32 o 496 497 " 11 #514 .540 . 14 * 32 $1 under $5,000 0 0 $5,000 under $10,000 0 o 0 0 0 $10,000 under $15,000 520,891 39.140 2.005 - 76 21,326 951 534.175 40,167 $15,000 under $20,000 " 82,235 520,891 39.140 " 1,235 24.02 2,741 93,059 16,34 198,322 19,974 $20,000 under $25,000 * 82,235 " 1,235 52,343 12,157 69.383 19,553 121,726 31,709 $25,000 under $30,000 70,206 26,092 83,750 31,953 155,958 $30,000 under $40,000 59,642 281,767 129,776 239,827 159,591 99,773 35,65 616,368 $40,000 under $50,000 325,034 281,767 129,776 1 17.875 41,874 202,411 147.250 62.548 25,237 378,799 214,360 $50,000 under $75,000 - 572 117.875 41.874 6,344 646.963 526,753 70,766 36,049 719,094 567.453 $75,000 under $100,000 *6,344 * 572 638,921 550,640 " 6,012 6,690 646,903 566,527 $ 100,000 under $200,000 1,461,255 1,347,883 1,466,552 1,356,307 $200,000 under $500,000 256 0 " 470 0 1,708 6,598 $500,000 under $1,000,000 819 650 $1,000,000 or more ol 474 527 0 Nontaxable returns, total 25,483,360 64,710,928 20,450,213 36,234,771 4,044,043 3,620,186 1,765,859 1,672,424 Foolnoles alend of table. 2, 181,234 780,274 1,473,496 404.464