

Question: https://www.perdisco.com/resources/html/statsTablesormalCDF.htm The government of Preon (a small island nation) was voted in at the last election with 59% of the votes. That was 2 years
https://www.perdisco.com/resources/html/statsTablesormalCDF.htm
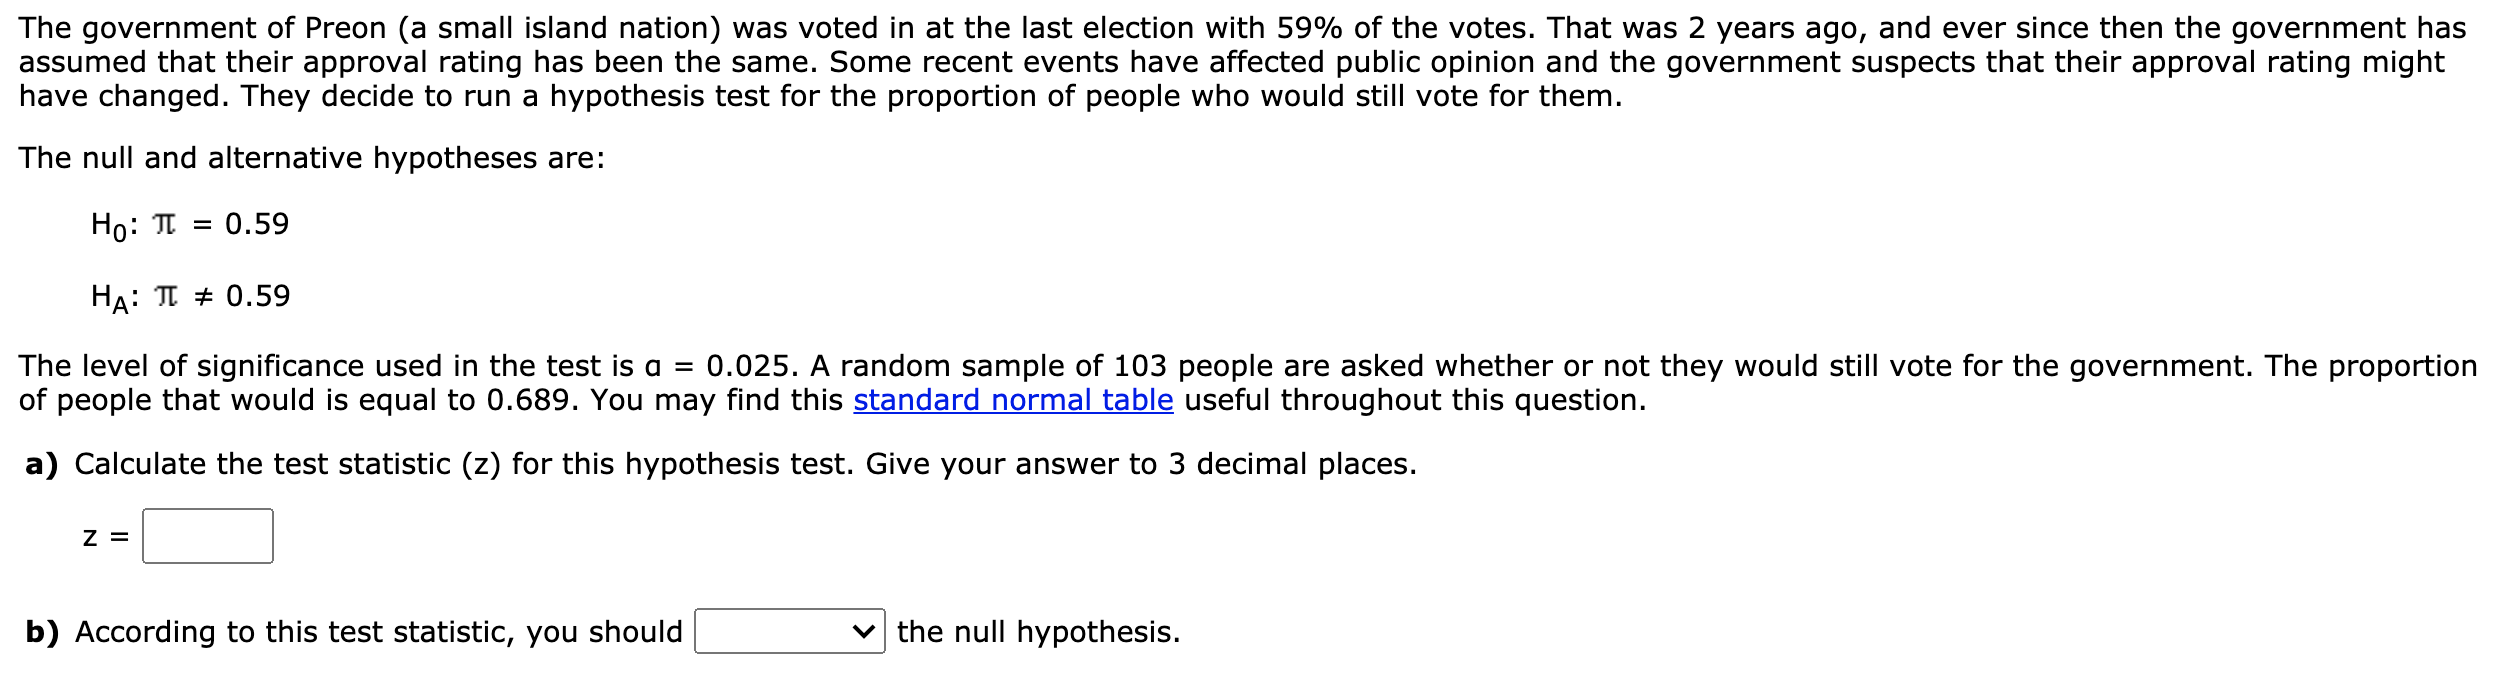
The government of Preon (a small island nation) was voted in at the last election with 59% of the votes. That was 2 years ago, and ever since then the government has assumed that their approval rating has been the same. Some recent events have affected public opinion and the government suspects that their approval rating might have changed. They decide to run a hypothesis test for the proportion of people who would still vote for them. The null and alternative hypotheses are: H0: 'II = 0.59 HA: 11: at 0.59 The level of significance used in the test is a = 0.025. A random sample of 103 people are asked whether or not they would still vote for the government. The proportion of people that would is equal to 0.689. You may find this standard normal table useful throughout this question. a) Calculate the test statistic (z) for this hypothesis test. Give your answer to 3 decimal places. 2 = b) According to this test statistic, you should v the null hypothesis
Step by Step Solution
There are 3 Steps involved in it

Get step-by-step solutions from verified subject matter experts